
Financial Analysis: Develop a Strategy Map
After setting the mission and vision, the next step is often creating a strategy map and a balanced scorecard. Together, the strategy map and the balanced scorecard inform the development of the strategic plan.
A strategy map is a visualisation designed to validate and communicate the strategy to stakeholders in a form they can understand, follow, and realise. The strategy map connects input perspectives such as people, technologies, and processes with outcome perspectives such as customer and financial expectations.
Six steps to develop a strategy map
1. Specify an overriding objective
The overriding objective contains financial and time targets. For example: To increase return on investment by 6% in the next two years.
2. Choose a value proposition
With strategy mapping, the organisation can choose the value propositions that will help them win in the marketplace (i.e. the ultimate value being offered to customers, which is more compelling than the value offered by competitors).
Value propositions include:
- operational excellence (e.g. first to market, brand image, and unique attributes)
- product leadership (e.g. price, quality, and selection)
- customer intimacy/solutions (e.g. customer service and relationship management).
3. Choose the relevant financial strategies
Every strategy has a goal and will inform how you develop the activities to achieve that goal. Goals might be related to increasing revenue, increasing productivity, and maximising the use of assets.
Financial strategies can be in three main categories:
- revenue growth
- productivity
- asset use.
Organisations identify the goal and then choose one or all of the three areas of financial strategy before choosing the customer strategy.
4. Choose the customer strategies
The strategy to engage customers (to ultimately increase the organisation’s revenue) is also linked to the financial strategies. The organisation identifies and selects the customer strategies that support the business objective and that are aligned with the chosen financial strategy.
The choice of the customer strategy is based on the goals and objectives set out by the business. Goals might include increasing customer retention, increasing revenue from customer spending, or reducing the cost of supporting customer experience and satisfaction.
Customer strategies can be:
- retaining and adding customers
- increasing revenue per customer
- reducing cost per customer.
5. Execute the strategies
The next step is to develop a plan of action to implement or execute the strategies. Strategies can be executed by identifying the correct business process and activities.
6. Plan the learning and growth strategies
The learning and growth strategies for the organisation are also planned and reflected in the strategy map.
Learning and growth strategies acknowledge gaps in skills, knowledge, and ability to execute the relevant strategy. Learning and growth can be classified as human capital, information capital, and organisational capital.
How are these classifications of capital different, and why are they relevant to the strategy map?
- Human capital is the economic value an organisation derives from applying the knowledge, collaboration, and engagement of individuals.
- Information capital is how organisations use their information systems, networks, and IT infrastructure to execute strategy and gain competitive advantage.
- Organisational capital focuses on a company’s ability to connect employee goals to corporate goals.
If the organisation is aware of these three resource categories, it can plan and budget for their use.
This example shows you what a strategy map looks like in practice.
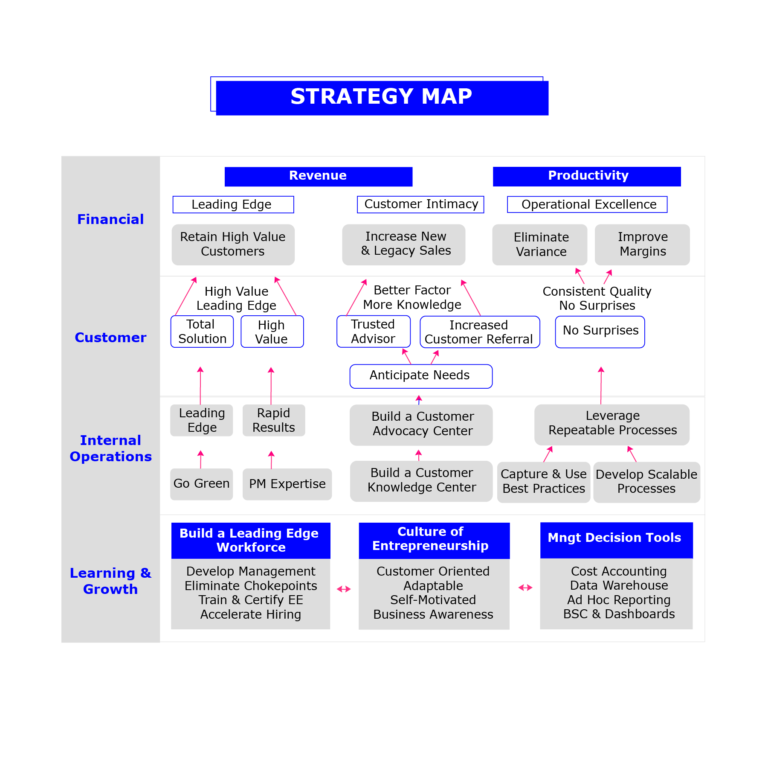
Download this template and create a strategy map for the organisation you work for. There is also a PDF version below.
Download: Strategy-map-template-PerformCo [1]
A strategy road map plots the key milestones over a period of time to achieve the strategic objectives of an organisation. It shows the organisation’s strategy on a single page.
Ask the following questions when plotting a strategy map.
- Does the organisation need a more effective way to articulate and communicate the strategy?
- Should there be better alignment of mission, vision, and strategy?
- Is the organisation willing to endorse a process that clarifies objectives, value proposition, and key financial and non-financial measures to achieve strategic objectives?
- Do the decision-makers have enough buy-in to lead and implement the strategy?
Organisations use the strategy pyramid to visually represent how the mission translates to the strategic outcomes.
A strategy pyramid cascades the organisation’s mission into strategic outcomes.
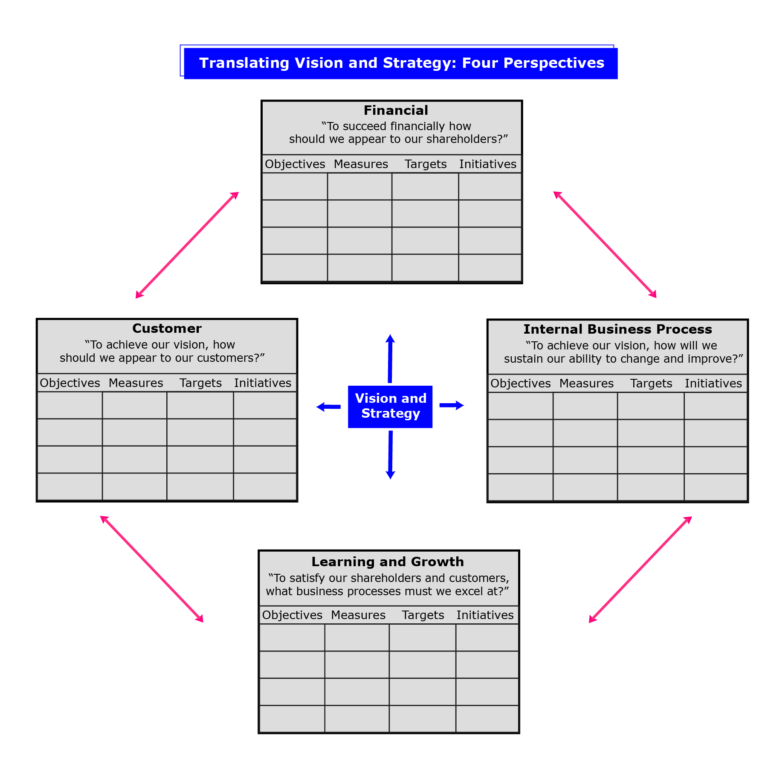
Characteristics of the balanced scorecard model
- Learning and growth: Learning and knowledge resources are investigated to see how well information is used by employees to convert it into a competitive advantage.
- Business processes: The evaluation of business processes is based on how well products are manufactured and/or services provided. Processes are analysed to track bottlenecks, gaps, delays, shortages, and waste.
- Customer perspectives: Customer satisfaction is evaluated on quality, price, and availability of offerings.
- Financial data: Sales, income, and expenses are used to understand financial performance. Such financial metrics include financial ratios, income targets, and budget variances.
The following diagram shows how the balanced scorecard plots the four aspects of the organisation’s vision and strategy.
Follow these steps to build a balanced scorecard:
- Identify critical outcomes that determine organisational success.
- Identify processes that lead to these outcomes.
- Craft KPIs.
- Capture reliable data and develop reliable measurement systems.
- Build a reporting mechanism to communicate to managers.
- Establish programmes to ensure performance improvement.
Balanced scorecards are used to:
- clarify and update strategy
- communicate strategy throughout the organisation
- link strategic objectives to long-term targets and annual budgets
- conduct periodic reviews to monitor the performance and update strategic initiatives.
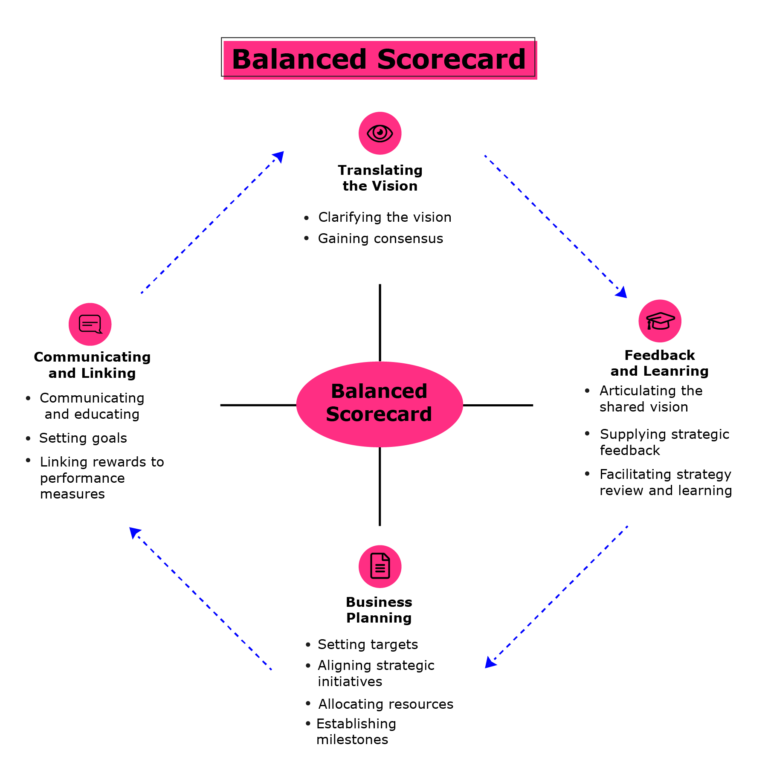
Kaplan and Norton explain the practical uses of a balanced scorecard.
Read: Using the balanced scorecard as a strategic management system (PDF) [2]
How do organisations track and manage the progress of strategic performance?
You can use dashboards that are built in-house or by external vendors to track and manage progress.
Dashboards capture strategic performance measures based on:
- relevance to the strategic objectives
- ability to set targets
- ease and consistency with which data can be collected
- appropriate frequency of collection and review
- knowledge and clarity of underlying calculations.
These performance measures can be classified as ‘leading’ and ‘lagging’ indicators (performance measures). Lagging measures capture what has already happened. Leading indicators measure how a lagging indicator will perform in the future. For example, service timeliness is a leading performance measure for client satisfaction.
Below is a Tableau dashboard. You can use a variety of systems and tools to build or access a dashboard to measure performance and capture KPIs.
References
- Strategy-Map-Template-PerformCo [PPT]. Available from: http://criticaltosuccess.com/wp-content/uploads/2015/05/Strategy-Map-Template-PerformCo.pptx </br>
- Kaplan RS, Norton DP. Using the balanced scorecard as a strategic management system [PDF]. Harvard Business Review. Available from: Microsoft Download Center
Financial Analysis for Business Performance: Planning, Budgeting, and Forecasting


Financial Analysis for Business Performance: Planning, Budgeting, and Forecasting
Reach your personal and professional goals
Unlock access to hundreds of expert online courses and degrees from top universities and educators to gain accredited qualifications and professional CV-building certificates.
Join over 18 million learners to launch, switch or build upon your career, all at your own pace, across a wide range of topic areas.


