
Effective Data Presentation
In 2009, Dr Hal R Varian, Google’s Chief Economist, stated, ‘The ability to take data – to be able to understand it, to process it, to extract value from it, to visualise it, to communicate it – that’s going to be a hugely important skill in the next decades.’ [1]
More than a decade later, you can see that the ability to deliver effective presentations has become a critical skill for communicating actionable insights in the twenty-first century.
Stephen Few, a data visualisation expert, said, ‘Numbers have an important story to tell. They rely on you to give them a clear and convincing voice.’[1]
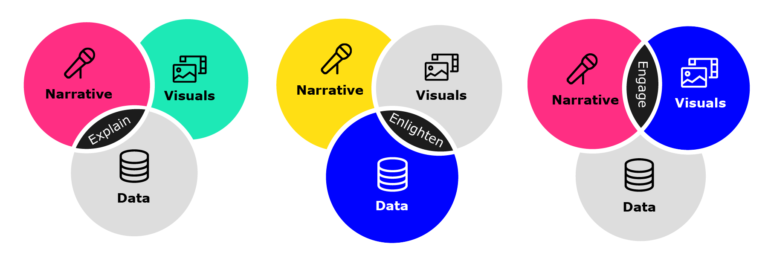
We use data presentations, visuals, and narratives to explain, enlighten, and engage our data users or target audience.
Key Elements When Presenting Data
There are six key elements to consider when presenting data.
Let’s break these down and look at some of the key considerations for each.
- Visual communication: Consider the type of platform you have, and the visual aids such as charts, graphs, and images you intend to use for your data presentation.
- Audience and context: Identify your internal and external target audiences. These audiences have specific objectives for accessing your data analysis and presentations. Know your audience’s data needs.
- Focus on important points: Align your data presentation to address questions and key business needs. Prioritise your points and justify communicating them.
- Storytelling: Communicate data insights as a story. (We’ll explore this more a little later.)
- Persuasiveness: Present your message persuasively and clearly. Ask yourself, ‘What next?’ and ‘So what?’ to test how persuasive your presentation is.
- Dashboards: Dashboards are a great way to combine two or more data analysis projects, to provide a more holistic view of a business issue or a market trend.
Common Pitfalls of Data Presentations
Tableau has identified some traps to avoid when presenting your data to an audience, but they also apply to written accounts, recordings, or interactives.
- Absence of a story or narrative
The presentation is delivered in the form of a report. For example, there is no narrative or explanation as to why a particular trend is taking place and what to expect in the future.
- Visualisations in the slide are not referenced
The presentation is made at a high level, but doesn’t refer to the charts or graphs in the presentation. Or the presenter hovers over the data visuals without referring to them.
Ask yourself why you’ve included the charts. What issue or trend do you want your audience to spot or understand through the charts and graphs that you’ve included?
- Lack of audience engagement
Weak presentations don’t include the audience. Great presentations engage them from beginning to end, and in a question-and-answer session. Invite your audience to ask questions, provide feedback, and add comments.
- Too much information
Information overload can make your presentation ineffective. ‘Chunk’ and target your information to address key business problems. Present your information as a summary rather than scripting (and then reading) every word you intend to say.
References
1. Dykes B. Data Storytelling: The Essential Data Science Skill Everyone Needs [Internet]. 2016 Mar 31. Available from: https://www.forbes.com/sites/brentdykes/2016/03/31/data-storytelling-the-essential-data-science-skill-everyone-needs/#4bc42f4b52ad
Financial Analysis for Business Decisions: How to Use Tableau and Financial Modelling


Financial Analysis for Business Decisions: How to Use Tableau and Financial Modelling
Reach your personal and professional goals
Unlock access to hundreds of expert online courses and degrees from top universities and educators to gain accredited qualifications and professional CV-building certificates.
Join over 18 million learners to launch, switch or build upon your career, all at your own pace, across a wide range of topic areas.


