
Reducing water demand by domestic consumers
In this activity, we introduce the concept of reducing water demand by domestic consumers as one way of strengthening water security.
We’ll do this through the example of Cape Town, South Africa, and some examples from other places around the world. The aim is that you gain an understanding of how water behaviour can have a strong impact on water security.
After completing this activity you should think more critically about:
- the role of behaviour in the amount of water we use directly
- measures to reduce our demand for water
- how you might reduce your own water footprint
How much water do we use?
The amount of water we use for domestic purposes is closely related to its availability, the amount of effort it takes to access it and the level income we have.
Where water is plentiful and comes out of a tap in our house then we tend to use more of it, with those on higher incomes tending to use the most. Those living in hot and arid climates also tend to have a higher demand for water, all other things being equal.
In Table 1 we can see some figures for the average amount of water used per person per day in different countries. Making comparisons is difficult and we should try to distinguish between the amount of water used by consumers from that supplied.
A surprising amount of water supplied (figures of one third are not unusual) is lost through leakage before it even reaches the consumer.
This table shows the average daily domestic water use per person for selected countries
| Country | Average daily domestic water use (litres per person) |
|---|---|
| UK | 149 |
| South Africa | 115 |
| USA | 333 |
| Germany | 121 |
| Australia | 340 |
Averages are always problematic, as they hide inequalities and differences in use. These might be geographic, such as in Australia where it’s reported that average daily water use ranges from just 100 litres per person in some coastal areas to more than 800 litres per person in drier inland areas.
The most significant reason for differences in average water use though tends to be income related. Those with lower levels of income tend to use less water.
This graph illustrates this with an example from Windhoek, Namibia, demonstrating the divergence from the average based on a survey undertaken in 2010.
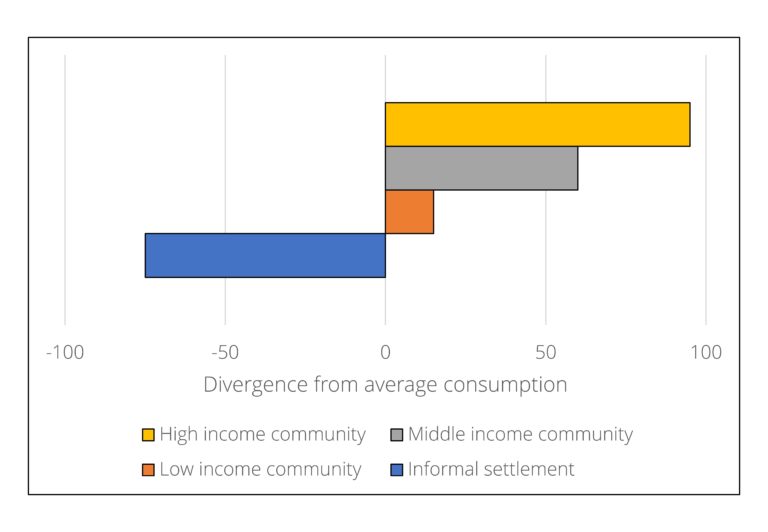 Variations in average amount of water used by households (%)
The reasons for such differences are related to lifestyle as well as the availability and cost of water. Watering a garden or washing a car takes a lot of water, and in the house itself things like using a washing machine will also add to the total amount of water used.
For most households, simple actions like flushing a toilet or taking baths and showers can rapidly add to the amount of water being used.
This table shows some estimates by one Australian water council of the typical amounts of water required by simple household activities.
| Action | Water consuption |
|---|---|
| Toilet flush (single flush cistern) | 12 litres |
| Bath | 100 litres |
| Shower (10 minutes) | 200 litres |
| Dishwasher load | 50 litres |
| Brushing teeth (with tap running) | 5 litres |
| Drinking, cooking, cleaning per person per day | 10 litres |
| Hand basin (per use) | 5 litres |
| Garden sprinkler (per hour) | 1000 litres |
| Garden dripper (per hour) | 4 litres |
| Car washing with hose | 200 litres |
| Hosing driveway | 100 litres |
| Total daily consumption per household | 900 litres |
Many of these activities will be spread over a number of days, or across a family. However, the table indicates how much water consumption can be affected by just a few common actions.
Water saving technologies, such as low flow shower heads can help reduce consumption, but sometimes more radical actions are needed, especially during periods of acute water shortage.
In the next step, we’ll illustrate this with a recent example from Cape Town, South Africa.
Over to you
- Based on the estimates provided above, how much water do you think you personally use daily within your household?
Let us know in the comments.


Reach your personal and professional goals
Unlock access to hundreds of expert online courses and degrees from top universities and educators to gain accredited qualifications and professional CV-building certificates.
Join over 18 million learners to launch, switch or build upon your career, all at your own pace, across a wide range of topic areas.


