
EUFIC UK Consumer Study Part 2
Levels of processing (answer to question 8)
The participants were shown a selection of apple products and asked how processed they thought they were. They rated them from 1 to 4, with 1 being the least processed and 4 the most processed. The whole apple was rated the least processed and the pie got the highest score.
Figure 1. Bar chart showing the scores participants gave to a range of apple products. The asterisk denotes a p <0.05 in comparison with the least processed product (whole fruit).
Finally, the consumers were asked to rate a selection of products in four categories, ranking them on how ‘processed’ and ‘healthful’ they thought they were.
Processed vs. healthful (answer to question 9)
In this question, researchers wanted to evaluate whether participants perceived a relationship between the level of processing and the food’s healthfulness. As with the previous question, the idea was to rate the products in four different food categories on a scale of 1 to 4: 1 indicating the lowest and 4 the highest level of processing or healthfulness.
In all four categories, the difference between the product that was rated least processed and the other three, higher rated products was significant. In general, foods rated as more processed were perceived as less healthful, and vice versa. Only in the case of dairy products was no correlation found between the perceived level of processing and healthfulness.
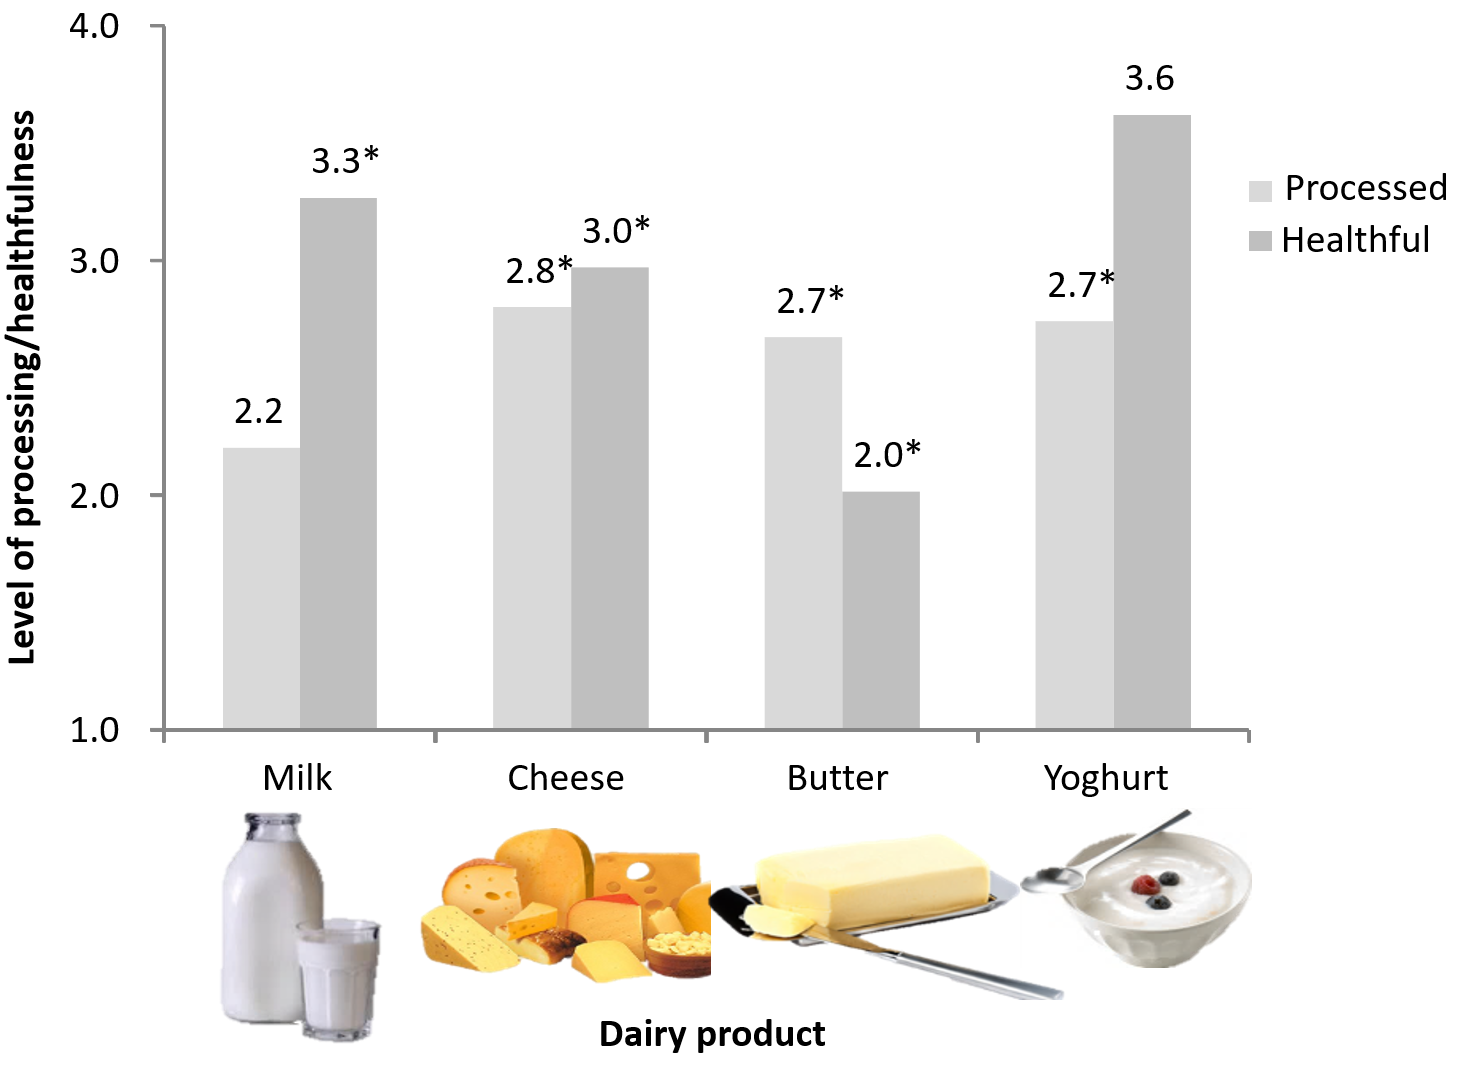
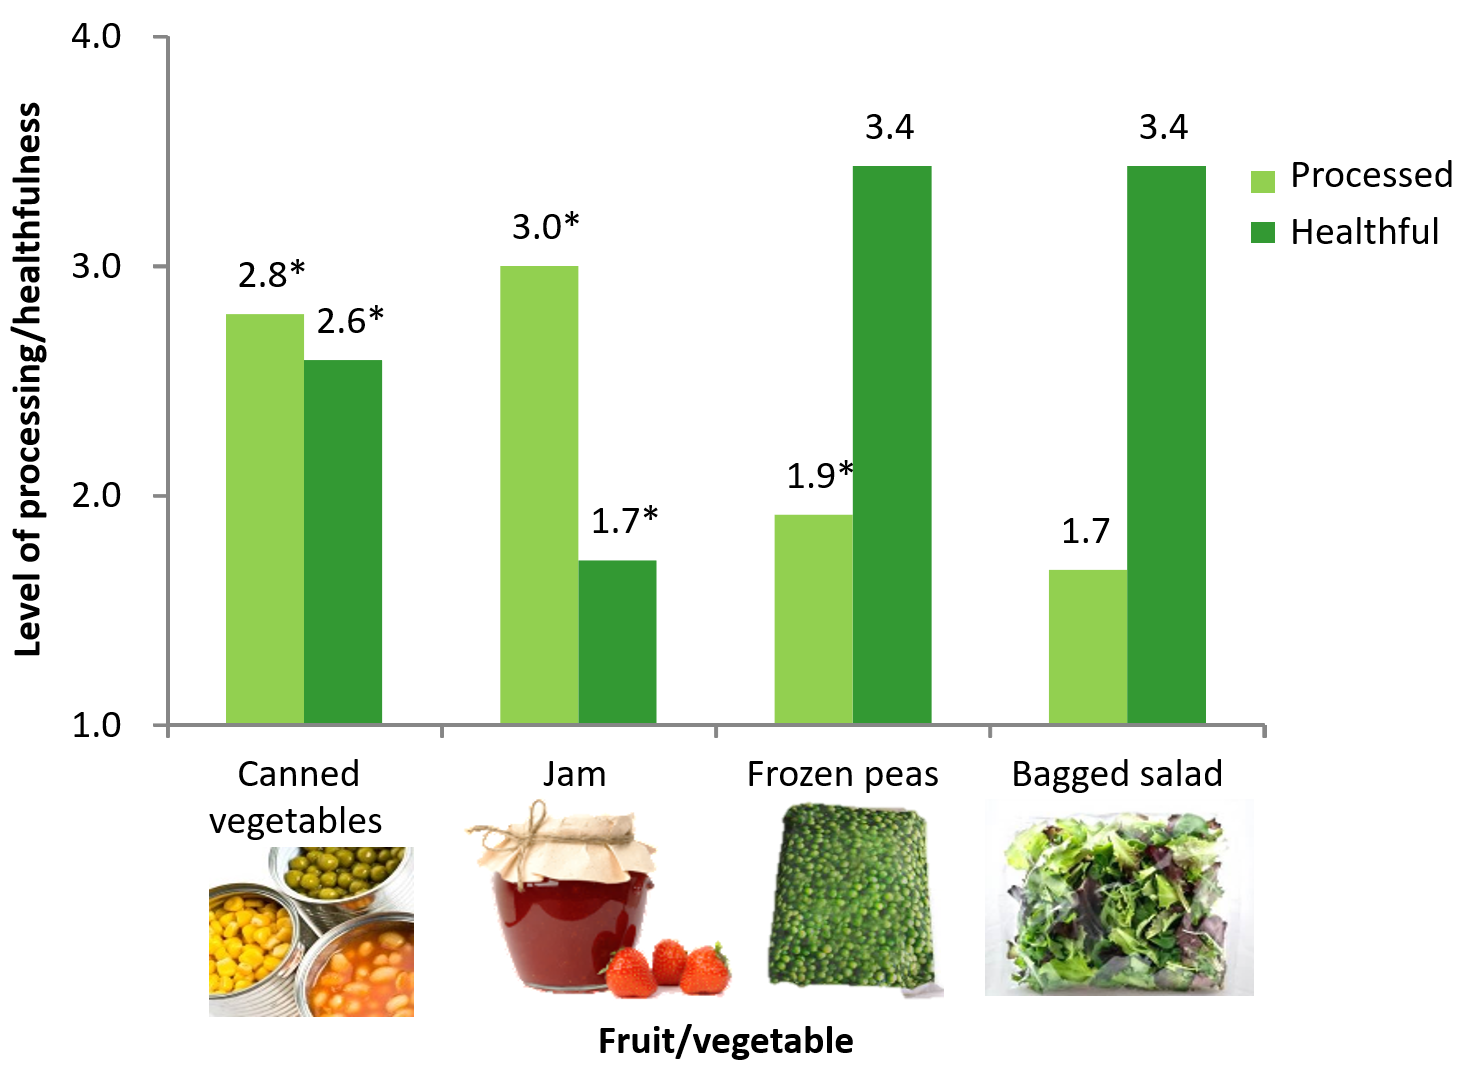
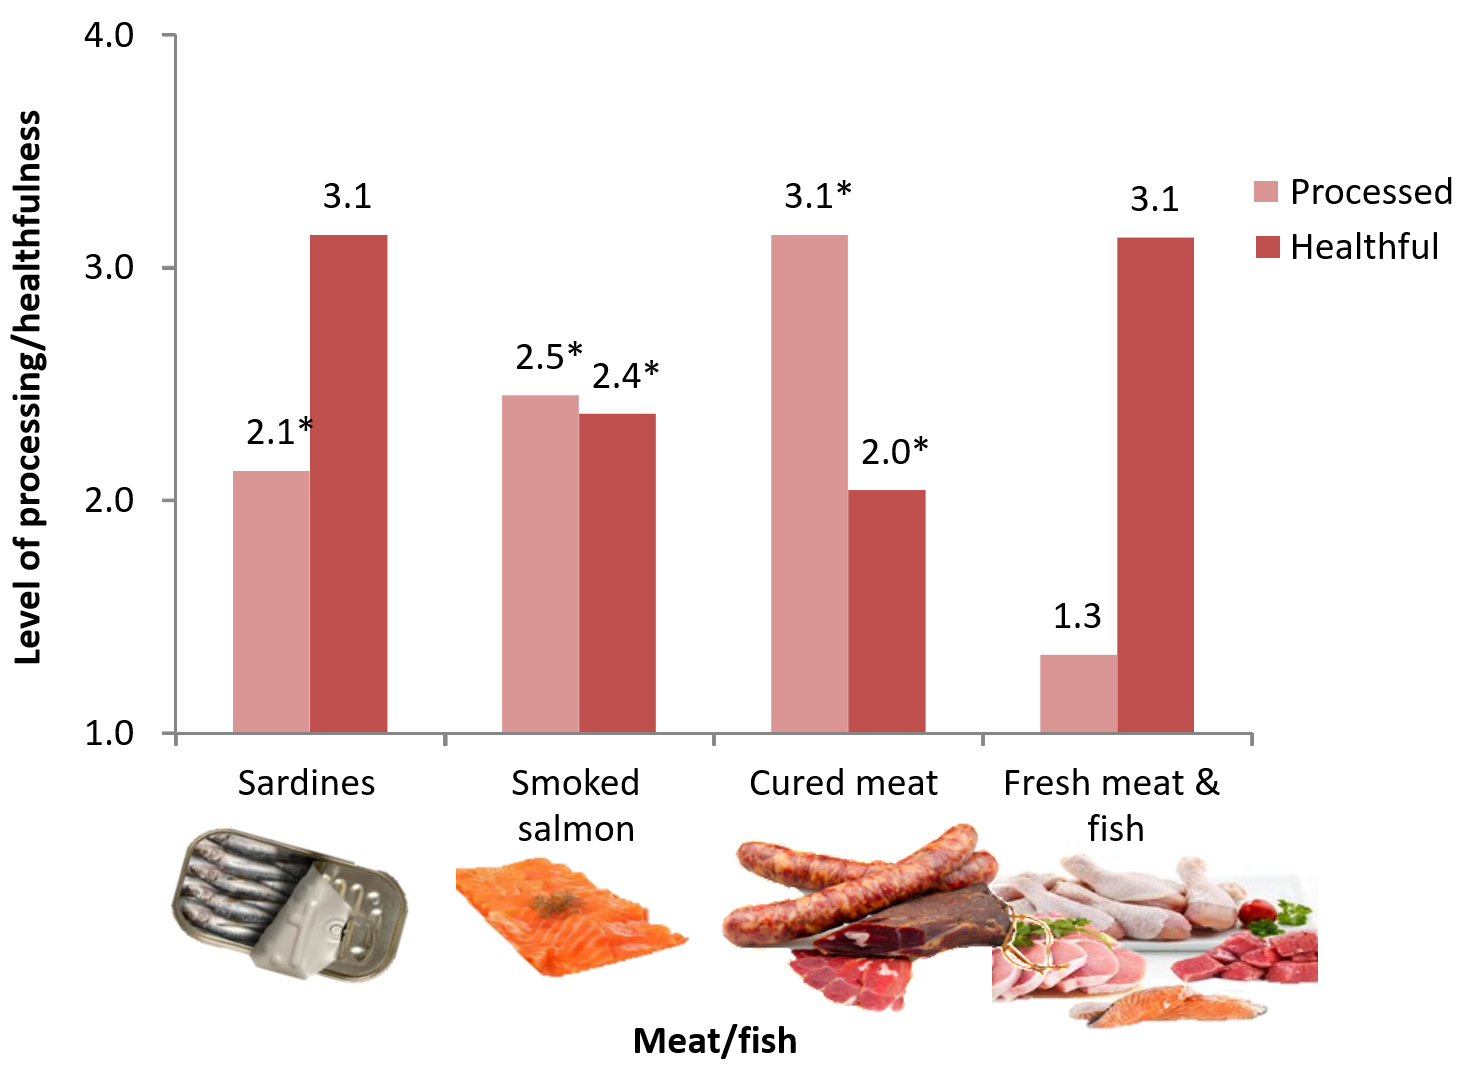
Figure 2. Average scores given to a range of products for food processing and healthfulness. The asterisk denotes a p <0.05 in comparison with the least processed or healthful product.
How Food is Made. Understanding Food Processing Technologies


How Food is Made. Understanding Food Processing Technologies
Reach your personal and professional goals
Unlock access to hundreds of expert online courses and degrees from top universities and educators to gain accredited qualifications and professional CV-building certificates.
Join over 18 million learners to launch, switch or build upon your career, all at your own pace, across a wide range of topic areas.


