
Map-based technologies – vegetation indices
Vegetation indices enable monitoring of crops over the growing season and, when combined with other technologies such as soil and yield maps, can support variable rate application of fertilisers and pesticides, reducing inputs and interventions.
What are vegetation indices?
Vegetation indices are being increasingly used to remotely assess crops [1]. Vegetation both absorbs and reflects light (solar radiation). Measuring and comparing this absorbed and reflected light enables vegetation indices to be calculated and used to assess, for example, vegetation ground cover, chlorophyll content, plant water stress and plant biomass [2].
Vegetation indices are calculated using data collected by drones or satellites with multispectral sensors which measure visible and non-visible (eg ultraviolet and infrared) light. As shown in the diagram below, a well-developed, healthy crop reflects a lot of green and infrared light (shown as purple-pink) from sunlight but absorbs a lot of the red and blue light. Poorly developed, dried out plants or exposed soil reflect less infrared and more red than healthy plants [3].
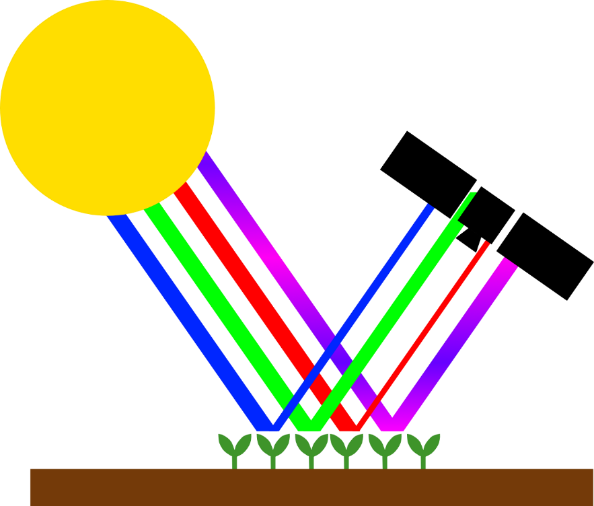
Capturing multispectral data by satellite. The well-developed, healthy crop reflects more green and infrared light (shown as purple) whereas poorly developed, dried out plants or exposed soil reflect little infrared and more red. © SatAgro
NDVI (Normalised Difference Vegetative Index)
The most frequently used vegetation index is the Normalised Difference Vegetative Index (NDVI). It describes how vigorous crops are and it is calculated using the near-infrared (NIR) and red visible (RED) wavelengths [4]. However, as NDVI has limitations when working with dense vegetation and in some atmospheric conditions it is often combined with measures of soil moisture and crop water content (NDMI) [5,6].
How NDVI is calculated and how it corresponds to crop status © Agricolus
NDVI enables identification of areas with low vegetation cover.
Example NDVI map, red areas highlight areas of low crop cover. ©Agricolus
NDVI is simple to interpret: values vary between -1 and 1, each value corresponding to a different agronomic situation:
| NDVI | Agronomic situation |
| -1 to 0 | dead plants or inanimate objects |
| 0-0.33 | unhealthy plants |
| 0.33-0.66 | moderately healthy plants |
| 0.66-1 | very healthy plants |
The average NDVI of a field varies according to the variety and age of the crop [7,8]. In a single field where a crop tends to be the same age, areas with a significantly lower than average NDVI can highlight problems in vegetative development, for example: – nutritional stress – disease or infection – hail or frost damage.
There are some links in ‘See Also’ at the end of this step that you can follow to find out more about how NDVI is calculated.
NDMI (Normalised Difference Moisture Index)
The Normalized Difference Moisture Index (NDMI) identifies water stress in crops and is calculated using near infrared (NIR) and short-wave infrared light (SWIR)[9]. The NDMI is calculated as the ratio between the difference and the sum of the refracted radiations in the near infrared (NIR) and short-wave infrared (SWIR); NDMI = (NIR-SWIR) /(NIR+SWIR).
Example NDMI map where red areas show areas of water stressed crop plants. ©Agricolus
NDMI values vary between -1 and 1, with each value corresponding to a different agronomic situation. NDMI varies according to the age of the crop, areas where the NDMI is significantly lower than the average can highlight water stress and areas where the NDMI is lowest are where the plants are most stressed. The table below (Agricolus NDMI index) shows some example NDMI values and corresponding situations. We can see from the ambiguity in some of the interpretations that further information is needed in order to assess the problem and decide on a course of action.
| NDMI | Interpretation |
| -1 to -0.8 | bare soil |
| -0.8 to -0.6 | almost absent canopy cover |
| -0.6 to -0.4 | very low canopy cover |
| -0.4 to -0.2 | low canopy cover, dry or very low canopy cover, wet |
| -0.2 to 0 | mid to low canopy cover, high water stress or low canopy cover, low water stress |
| 0 to 0.2 | average canopy cover, high water stress or mid-low canopy cover, low water stress |
| 0.2 to 0.4 | mid to high canopy cover, high water stress or average canopy cover, low water stress |
| 0.4 to 0.6 | high canopy cover, no water stress |
| 0.6 to 0.8 | very high canopy cover, no water stress |
| 0.8 to 1 | total canopy cover, no water stress / waterlogging |
There are some links in the See Also section at the end of this article if you’d like to find out more about NDMI.
The range of vegetation indices
Over 100 vegetation indices have been developed to cover different agronomic situations [10]. They can be classified by crop, soil and water content:
-
Vigour indices, such as NDVI, cover plant development in terms of green biomass and ‘greeness’ (the green colour of the plant – chlorophyll). An area with a low NDVI may be affected by chlorosis, or have poor vegetative development. NDVI is one of the most commonly used and simplest to calculate, however, others such as REIP (Red Edge Infection Point) and NDRE (Normalised Difference Red Edge) are also common as NDVI has limitations when working with dense vegetation [11] and can be affected by atmospheric contaminants [12].
-
Soil adjusted indices such as TCARI (Transformed Chlorophyll Absorption Reflectance Index) and OSAVI (Optimised Soil Adjusted Vegetation Index) were developed, as NDVI can be affected by soil variation in areas with low vegetation cover [13, 14]. TCARI and OSAVI look for the presence of chlorophyll, making them useful in identifying chlorosis (loss / lack of chlorophyll).
-
Water stress indices, NDMI and NMDI (Normalised Multiband Drought Index) look at plant water stress or the water content of bare soil [15, 16].
Vegetation indices enable remote monitoring of crops and give a good illustration of biomass distribution, but they cannot always, for example, distinguish between weeds and crops [1]. Before using a vegetation index to plan a fertiliser or irrigation strategy, it needs to be combined with other data such as soil maps and knowledge of the land / field gained through, for example crop scouting, which we will look at in detail later this Week.
Innovation in Arable Farming: Technologies for Sustainable Farming Systems


Innovation in Arable Farming: Technologies for Sustainable Farming Systems
Reach your personal and professional goals
Unlock access to hundreds of expert online courses and degrees from top universities and educators to gain accredited qualifications and professional CV-building certificates.
Join over 18 million learners to launch, switch or build upon your career, all at your own pace, across a wide range of topic areas.


