
Practical: Making a digital image

Taking apart a digital image and putting it together again
As we saw in ‘What is a digital image?’, digital images are just tables of numbers (or sets of three numbers in the case of colour images). A simple way to prove this is by using Python to make a spreadsheet and colouring the cells in the table using the numbers stored in the image file.
To do this we will need a way, in Python, to do the following:
- Make an empty spreadsheet using Python
- Open an image, cycle through pixels in the image file and get the numeric data
- For every pixel, convert that numeric data to the colour format used by Excel
- For every pixel, colour specific spreadsheet cells with the right colour (and also write the data in the cell)
- Save our new spreadsheet
Python code and image data
The Python code below is an implementation of the list of tasks above. Don’t worry too much if this is the first time you’ve seen any Python code, or any code in general, and this is hard to understand. We’ll return to the code itself next week after we’ve looked at some programming in Python. For now, copy and paste the code into a text editor and save it with a suitable name like image_to_xls.py (the .py extension is important) in a folder you can navigate to easily from the command line (see the earlier article on the command line if you’re not sure how to do this).
import cv2
img = cv2.imread('robot.jpg') # change the input image filename here

import xlsxwriter

# Create a workbook and add a worksheet.
workbook = xlsxwriter.Workbook('robot.xlsx') # change the output spreadsheet name here
worksheet = workbook.add_worksheet()

# function for making a hex colour string
def get_hex_str(rgb,channel):

 hex_cols = ['00','00','00']

 hex_val = hex(rgb)[2:]

 if len(hex_val)==1:
 hex_val = '0' + hex_val

 hex_cols[channel] = hex_val

 hex_str = '#'+''.join(hex_cols)

 return hex_str


# make the spreadsheet
for i,row in enumerate(img):

 for j,column in enumerate(row):

 column = list(column)

 column.reverse()

 for k,rgb in enumerate(column):

 hex_str = get_hex_str(rgb,k)

 cell_format = workbook.add_format()

 cell_format.set_bg_color(hex_str)

 worksheet.write(3*i+k, j, rgb , cell_format)

# close the spreadsheet
workbook.close()

# print a message
print('Done')
The image we use as an example can be downloaded here (right click to save): robot.jpg
Make sure you save it with the name robot.jpg in the same folder as you saved the code text file.
Running the code
Before we can run the code we will need to make sure we have a couple of external packages installed, OpenCV and xlsxwriter. The easiest way to do this is using pip in a terminal window as follows, for xlsxwriter:
pip install xlsxwriter
and for OpenCV:
pip install opencv-python
If you have Anaconda installed you might find that xlsxwriter is already installed on your machine.
Once both these packages are installed we are ready to run the code. In the terminal window, navigate to the folder where the image and code are saved using cd.
Then, in the terminal window type:
python image_to_xls.py
All being well, the code should run, convert the image into a spreadsheet named robot.xlsx , save it in the same folder as the code and the image and print out the message Done.
Open it up and you should see something like this:

You can see the individual pixels as coloured cells in the spreadsheet, one row for each colour channel, red green and blue, and the numbers used to colour them displayed in the cells themselves. To see the full image, you’ll need to zoom out.
Other images
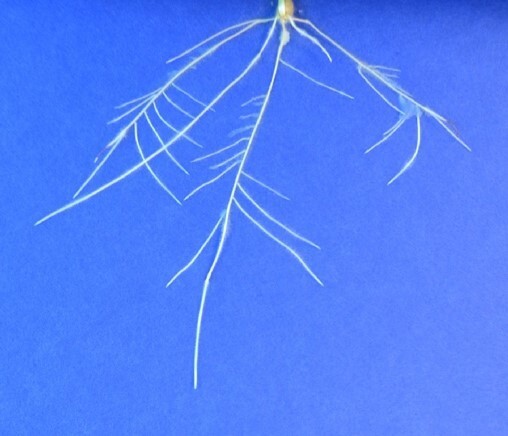
Try this out on some other images, for example:
or try your own images. You just need to change the code so instead of robot.jpg it has the alternative filename. You might also want to change the name of the output spreadsheet (look in the code for robot.xlsx and change it to a new name), otherwise the code will just save over the existing file.
If you do try your own images be warned – anything over a few hundred pixels by a few hundred pixels will take a long time to run, and the resulting spreadsheet might not open properly. This isn’t really what spreadsheets were designed for!
Hopefully this practical will have given you a feel of how image data, like any data, can be manipulated and displayed in many ways, and how to make and run Python code on your computer.
Introduction to Image Analysis for Plant Phenotyping

Introduction to Image Analysis for Plant Phenotyping
Reach your personal and professional goals
Unlock access to hundreds of expert online courses and degrees from top universities and educators to gain accredited qualifications and professional CV-building certificates.
Join over 18 million learners to launch, switch or build upon your career, all at your own pace, across a wide range of topic areas.


