Basic data analysis – quantitative data
As we learned in the previous step, different research methods produce different types of data and therefore need different methods of analysis.
This will be built into your research plan from the beginning – when you decide which method or methods you will be using in your research, you will know what type of data to expect and therefore what sort of information you will get from your analysis.
Quantitative data
Quantitative data is numerical. One of the most common quantitative research methods is using a survey or questionnaire.
For example, in step 1.2 we asked you to answer a poll that asked you about your level of knowledge of user research prior to starting this course.
We could have asked you to assign a number to how much you know about user research, with 1 meaning knowing nothing at all and 5 being very knowledgeable.
Let’s say that 100 learners answered that poll like this:
| Level of knowledge | Number of learners |
|---|---|
| 1 | 23 |
| 2 | 42 |
| 3 | 15 |
| 4 | 14 |
| 5 | 6 |
(Please note that these numbers are random!)
We can then show these results visually on a chart or graph.
It’s important to remember when choosing a format that the information is clear in multiple different ways. You should always have clear labels and information should never be communicated through colour alone.
This is a bar graph showing the numbers above:
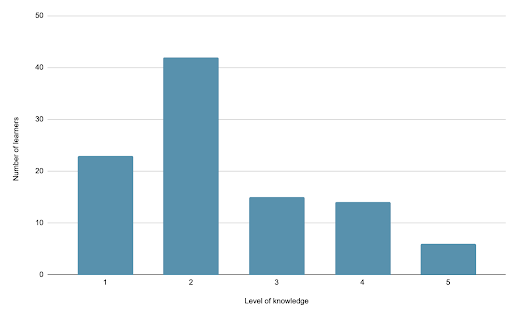
As we can calculate from the numbers or see visually in the chart, 77 out of 100 learners, or over 3 quarters of all learners, say they have at least some knowledge of user research.
On FutureLearn, courses are frequently updated and republished as new runs. Through analysing this data, we have found that a majority of learners had some knowledge of user research before joining the course.
In a future run of this course, we could use that result to justify going into more detail on certain topics without having to worry about overwhelming our learners with too much information.
Other quantitative methods
There are many other methods and types of analysis, but it would be too overwhelming to try and study them all here. We will cover more methods in detail in our upcoming Level 2 User Research course, but if you would like to know more, you can read this article on quantitative user research methods and how to analyse them from the Nielsen Norman Group.
Task
Just for fun, think back to your answer in the poll in step 1.2. If you had been asked to choose a number between 1 and 5, what would you have picked? (Remember, 1 means no knowledge and 5 means very knowledgeable.)
Now that we’re in Week 3, what number would you say you are now? Share your thoughts in the comments below.
User Research in Government: Getting Started


User Research in Government: Getting Started