Societal cost of zoonoses: One Health economics
It is paramount to assess the extent of the costs that human and animal diseases generate. One Health economic methods help to address the respective questions. This article introduces their basics.
What is a sector?
In economics, we distinguish between different sectors. First there is the private sector, which comprises the engine of the economy. Private enterprise spans from work done by a single person all the way up to that of corporations with thousands of employees. Essentially, private business seeks to be profitable.
There is also the public sector, which is the economy of a nation’s income from taxes and public spending. In health economy, there is a continuous debate around what expenses should be paid for by the private and which should be covered by the public sector. If freedom from a specific disease can be declared a public good, then it is the state’s responsibility to cover the cost of control.
We also distinguish between public health, livestock, environment, tourism and many other sectors. By their nature, zoonoses affect more than one sector, eg at least the public health and livestock sectors.
Cross sector assessments
This is a very important component of One Health. If we want to show a benefit from collaboration between sectors, eg the public health and animal health sectors, we need cross sector economic assessment. Such a perspective widens the horizon from one single sector, for instance, the livestock sector, to take a broader view, such as a societal perspective, which considers all involved sectors in the public and private realms. In economics, we speak about a societal analysis when we include public and private spending and income.
Cost menus in public and animal health
We often have to answer questions on the profitability for the health sector of an intervention outside the health sector. Here the involved sectors are the public and the private sectors. There are costs borne by the state and the private animal holders. There are also costs for the public health and animal health sectors and possibly others. Once the sectors are identified, we have to discover which specific costs are borne by whom.
Data collection
Data can be collected from several sources. Government statistics are useful to determine the official number of reported cases using health information systems. This number is often under-reported when the information system is not effective or diagnostic capacity is missing. Government spending is usually accurately recorded. There are important private costs which are generally not recorded. Patient-based household surveys or farmer interviews can estimate the private cost of treatment in humans and animals and coping costs. Coping costs are costs for employment when patients cannot fulfil their job.
For some parameters, neither public nor private information is available. In this case, ‘Delphi panels’ can be formed with experts on a special issue. For example, we wanted to know the proportion of abortions among brucellosis sero-positive cattle. Each expert gave an opinion, and an average was calculated. In a second round, the experts were given this average value and allowed to revise their opinion. The first round average along with the variability from the second round was used for the analysis. Independent field research is the best way to collect empirical data, but adequate funding is required.
Human health costs may be divided as follows:
- Inpatient costs: hospitalisation costs (public and private)
- Outpatient costs: cost of visiting doctors (private)
- Out of pocket expenses for health care (private transport, laboratory, drug costs)
- Informal treatment costs: visits to traditional healers (private)
- Loss of income (private)
- Coping costs (private) as described in Roth et al. 2003
Animal health costs may be divided as follows:
- Changes in animal numbers (stocks): these are asset values
- Changes in animal production (milk, meat, hides, wool, other products): difficult to directly measure, but can be simulated with livestock demographic models as introduced earlier (Tschopp et al. 2013)
- Cost of disease: implies also cost of controlling the disease
Vaccination campaigns, like for dog rabies, are effective interventions if the vaccine used is efficacious and the coverage is high. The cost of a vaccination intervention should include the cost of vaccines and also the cost of personnel, transport and campaign management (Kayali et al. 2006).
Who pays?
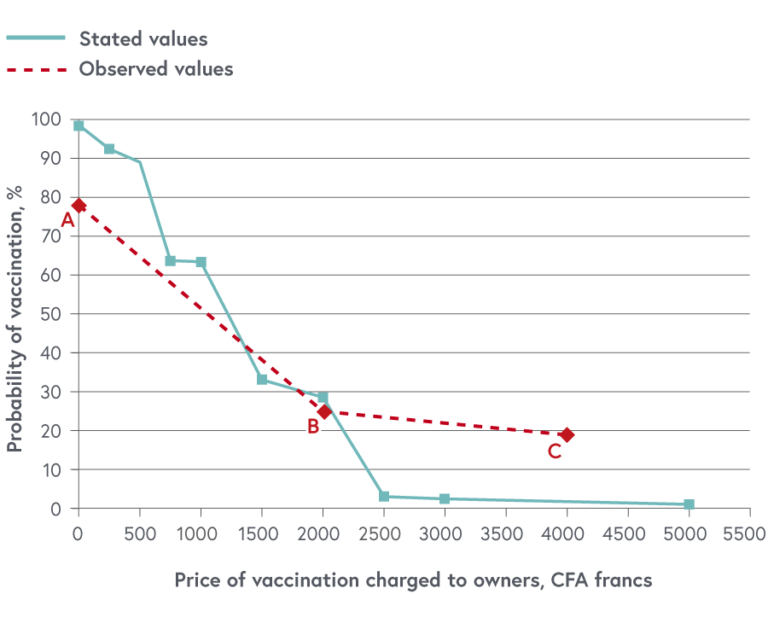
In health interventions, this is always an important question. The question arises if the control of a disease is a public or a private good. The control of transboundary diseases, like Foot and Mouth Disease (FMD), is often considered as a public good. However, zoonoses are most often considered as a private issue. We did a ‘willingness to pay’ study to assess how much dog owners in N’Djaména were willing to pay for dog rabies vaccination. Only 20% of the owners were willing to pay for the full cost of dog vaccination (see graph below), but we need to achieve coverage of 70% to interrupt rabies transmission. Therefore, eliminating or even controlling rabies is not possible unless it is declared a public good (Durr et al. 2008).
The graph below shows the average probability of having a dog vaccinated against rabies by cost charged for vaccination (observed versus owner-stated values for vaccination). The observed values of charges to vaccinate an owned dog against rabies and probability of vaccination came from three sources. Points A and B (recording vaccination coverage for all owned dogs vs costs charged) come from two vaccination campaigns held in N’Djaména in 2002 and 2006, respectively. Point C represents the midpoint of the range of recorded 2001 clinic charges in N’Djaména for vaccinating a dog against rabies (costs not adjusted for any potential inflation). The owner-stated amounts that they would be willing to pay for their dogs to be vaccinated against rabies came from a survey of 356 households, conducted in 2006. The graph shows the reverse cumulative probability of the stated values.
 Owner valuation of rabies vaccination of dogs in Chad
© Durr et al. 2008
Comparative cost, profitability and cost-effectiveness of interventions
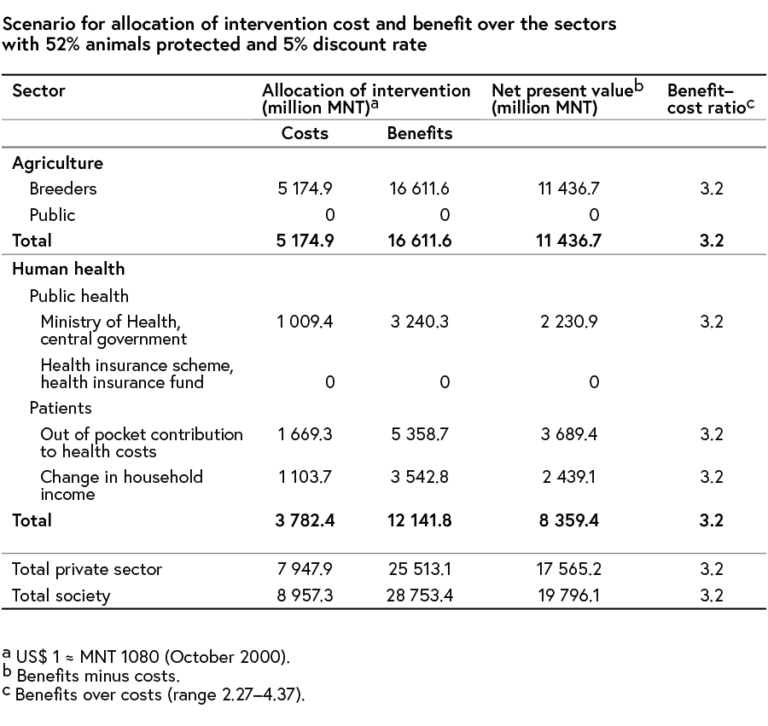
One Health economics utilises standard methods from public health economics. More details can be found in standard public health economics texts. For comparative cost analysis (CCA), we compare the cost of different interventions, typically in humans and animals, calculating the cumulated discounted cost, called the net present value (NPV), of each to see where they break even. The costs occur at different levels and in different sectors: there are private costs to dog owners and patients. There may be costs to the public sector, such as the health and other sectors. We divide the financial benefits of an intervention with the intervention cost, obtaining the benefit-cost ratio (BCR) to determine the profitability of an intervention (see image two). Benefits and costs may not be even between sectors. For cost-effectiveness analysis (CEA), we calculate the cumulative discounted cost per averted disability adjusted life year (DALY), aiming at the lowest cost per averted DALY (Zinsstag et al. 2009).
The table below shows that with the cost-sharing scenario, the intervention could be profitable for the health and agricultural sectors. The Ministry of Agriculture could meet its share of the project costs, possibly with donor support. As livestock breeders are likely to be the most favoured beneficiaries of the vaccination campaign economically, they might be willing to contribute to the campaign, and clearly there is some interest from the public sector in attaining a higher degree of cost recovery from this group. The patients are the second group of beneficiaries. As patients would have contracted brucellosis had there been no intervention, they avoid out-of-pocket expenses and income loss. Because there is no way of identifying people who might have avoided infection, no mechanism would allow to obtain their contribution to the intervention costs.
 Benefit-cost ratio of brucellosis mass vaccination in Mongolia applying a separable cost approach
© Roth et al. 2003
Separable cost
If costs have to be shared between sectors, this can be done proportionally to the benefits for each sector. The table shows the costs in the left column. Divide them by the benefits for each sector and confirm that the benefit / cost ratio is the same for every sector.
References
Durr, S. et al. (2008). Owner Valuation of Rabies Vaccination of Dogs, Chad, in: Emerging infectious diseases 14, 1650-1652.
Kayali, U. et al. (2006). Cost-description of a Pilot Parenteral Vaccination Campaign Against Rabies in Dogs in N’Djamena, Chad, in: Tropical Medicine & International Health 11, 1482.
Roth, F. et al. (2003). Human Health Benefits from Livestock Vaccination for Brucellosis: Case study. Bulletin of the World Health Organization 81, 867-876.
Tschopp, R. et al. (2013). Cost Estimate of Bovine Tuberculosis to Ethiopia, in: Current topics in microbiology and immunology Vol. 365, 249-268.
Zinsstag, J. et al. (2009). Transmission Dynamics and Economics of Rabies Control in Dogs and Humans in an African City, in: Proceedings of the National Academy of Sciences of the United States of America 106, 14996-15001.
Share this
One Health: Connecting Humans, Animals and the Environment

One Health: Connecting Humans, Animals and the Environment


Reach your personal and professional goals
Unlock access to hundreds of expert online courses and degrees from top universities and educators to gain accredited qualifications and professional CV-building certificates.
Join over 18 million learners to launch, switch or build upon your career, all at your own pace, across a wide range of topic areas.
Register to receive updates
-
Create an account to receive our newsletter, course recommendations and promotions.
Register for free


