
Indicators (Surveillance and M&E)
As we saw in Step 4.2, the routine tracking of a programme’s performance is defined as Monitoring; the periodic assessment of change in a programme is defined as Evaluation; systematic data accumulation, analysis and dissemination of information to influence programme or project action is referred to as Surveillance.
To collect data for the monitoring and evaluation (M&E) of interventions and for disease surveillance, health professionals must report information about the case diagnosis and treatment of VL and vector control activities, at multiple levels. Reporting is done at the local static public health clinic or mobile clinic, at a hospital, at the programmatic and national health system or international level. In this way clinicians, nurses, community health workers and vector control specialists all take part and must be trained in using reporting tools.
The type of data that is collected is defined by selected indicators. To be meaningful, a good indicator will be SMART (See box below). The regularity of collection, the analysis and interpretation of data collected against those indicators should also be pre-selected both in the context of surveillance activities and in monitoring and evaluation.
Box 1. A SMART Indicator
| Specific | Is the indicator narrow and focused to ask a question? (Who, what, where, when, how?) |
| Measurable | Can it be “counted, observed, analysed, tested, or challenged”? |
| Relevant | Can it certify that the results are actually showing a related impact? |
| Time bound | Is it attached to a clear time frame? |
Indicators for VL surveillance
In surveillance, indicators reflect the collection of data for standardised continuous reporting. A common application of the data collected in VL surveillance is the generation of basic epidemiological evidence about location, the demographics of the disease and diagnosis or treatment tools used. This helps understand whom VL affects, where and whether it changes over time. Ideally, vector surveillance should also be done – including measuring abundance of the sand flies, mapping sand fly species and reporting resistance to insecticides.
All this knowledge is important to national control programs and beyond, informing the international surveillance of the disease. Data collected in routine VL surveillance informs WHO global VL burden estimates, (those that we have seen throughout the course) and help set broader policy for the prevention and elimination of VL.
The table below gives some examples of indicators for control activities in the clinic as used by MSF. The WHO is currently developing a manual on VL surveillance and M&E indicators that will provide an expansive resource into the different indicators for different areas of control and surveillance.
Table 1. Examples of VL surveillance indicators: VL and PKDL at the clinic (Courtesy of MSF)
| Weekly reported | Other routinely reported indicators |
|---|---|
| Age and sex | Time between onset of disease and diagnosis |
| Mode of diagnostic confirmation | Location of patient |
| Mode of treatment | Cause of death |
| Initial cure rates | Proportion of positive tests (rK39 RDT’s, DAT, microscopy) in clinically suspect cases |
| Mortality rates | Date and mode of prior KA treatment in PKDL patients |
| Final cure rates | PKDL severity and type of lesions |
| Co-morbidities | |
| Complications during treatment | |
| Defaulters | |
| Loss to follow up | |
| Relapse rates | |
| HIV status |
Indicators for Monitoring & Evaluation (M&E) of VL control
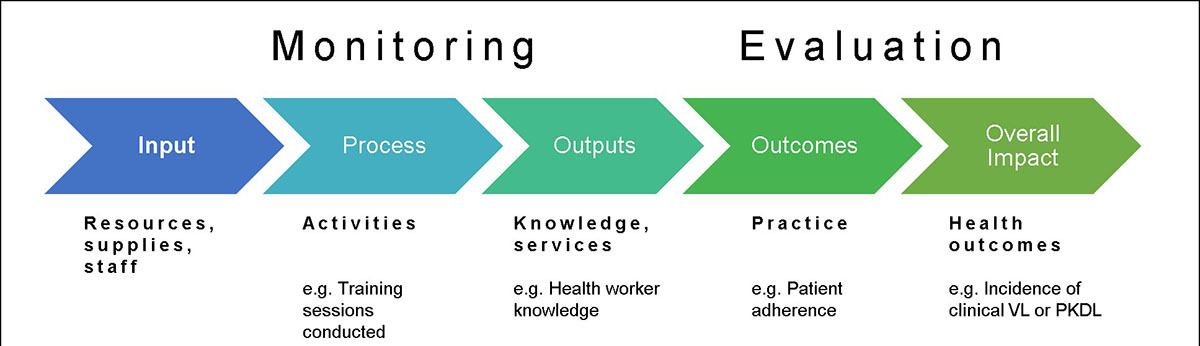
For monitoring and evaluation of activities in a program or of the entire program itself, indicators tend to relate to a “results chain” or “log-frame” of a programme, which sets out specific objectives/targets for the programme. A typical program involves Input into control and Activities to achieve specified Outputs. These outputs will in turn feed into defined Outcomes that reflect and hopefully bring about the longer –term or overarching goal, also referred to as the Impact of the programme. In order to measure progress, SMART indicators are needed across each stage of the results chain, from input to impact, and against each objective of the programme.
Figure 1. “Results chain” in a typical programme. Indicators are needed to measure progress against each stage.
It is important to remember in that in different countries and regions, M&E indicators need to be tailored to the local epidemiology of the disease and the priorities of the control activities set in a programme. Guidelines are available for the South Asia Region (look at the See also links) A WHO publication is in the pipeline for all VL regions and will be freely available soon.
How are indicators used to measure the progress against programmatic goal and objectives? Examples
An example from KalaCORE. KalaCORE is a programme supported by UK aid, which supports the development and implementation of national control programs in 6 endemic countries. The overarching goals for programmatic impact are to reduce of economic burden of VL reduced for each country and VL case fatality rate by region. Figure 2, below, illustrates the concept of having indicators to measure the progress against the programme goal and objectives. A more detailed breakdown of indicators applied and used throughout the programme is accessible on the KalaCORE Project M&E Guide (2015).
Figure 2. An example from the KalaCORE VL control programme: understanding progress by measuring related objectives and M&E indicators.

Other applications of M&E data
- Access to care – Distance travelled to health facility and possible foci of cases. Timing of presentation to the clinic (late stage severe disease?)
- Quality of care – choice of drugs, mortality
- Usability and relevance of diagnostics, and quality control of diagnosis
- Responsiveness of a health system and supply chain information
- Monitoring responses to treatment and side effects of drugs used (pharmacovigilance) and detect drug resistance emergence
- Notification and guidance of vector control activities: distribution of nets and spraying sites and quality. Monitoring of potential changes in endemicity and transmission dynamics (reservoirs, transmission cycles). Detection of emergence of new foci or breeding sites.
Control and Elimination of Visceral Leishmaniasis


Control and Elimination of Visceral Leishmaniasis
Reach your personal and professional goals
Unlock access to hundreds of expert online courses and degrees from top universities and educators to gain accredited qualifications and professional CV-building certificates.
Join over 18 million learners to launch, switch or build upon your career, all at your own pace, across a wide range of topic areas.


