
The law of demand
You should now have a clear recognition of the key macroeconomic issues in the larger economy and how they affect the decision-making of staff at logistics and transport businesses.
We’re now going to explore some key microeconomic concepts, which are ideas attempting to describe how the mechanics of an economy work, such as a market. Demand and supply are key microeconomic concepts and help to explain why we produce and buy goods and services. This leads to the formation of markets, where we buy and sell things.
This mechanism of supply and demand works the same in transport and logistics, but with a slight twist. We’re going to start by looking at how demand and supply work, then we’ll apply it to transport later.
Demand and supply are best explained using graphs and discussing why various curves slope in a particular way and move within the graph. Let’s start by defining the law of demand. According to Webster’s dictionary, the law of demand is where:
…the quantity of an economic good purchased will vary inversely with its price(Merriam-Webster, n.d.).
This means that (when all else is equal) as the price of the economic good/service falls, the quantity demanded of it rises, and vice versa. This can be demonstrated on a graph as a curve, showing the various amounts of a product that consumers will buy at each of a series of possible prices, during a specific period.
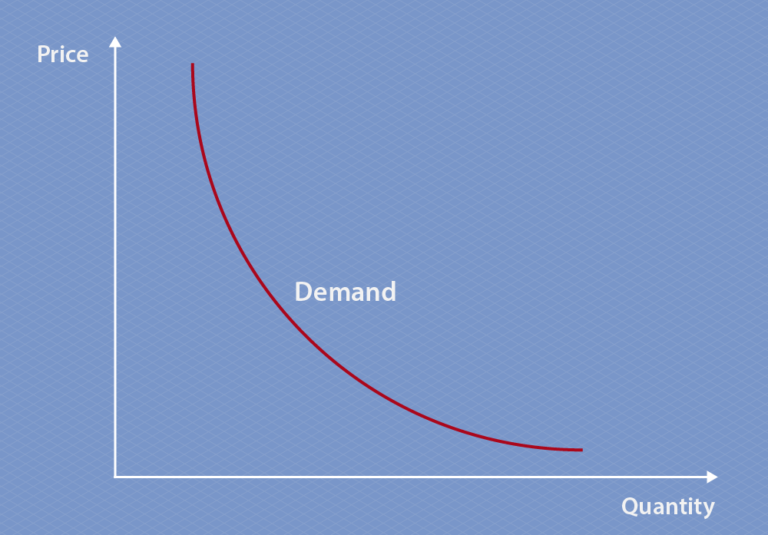
Why does the curve flatten as you buy more goods? This is because of the Law of Diminishing Marginal Utility. Utility is the extra satisfaction that one receives from consuming a product. Marginal means one extra, while diminishing means decreasing; so, put together, diminishing marginal utility means you get less satisfaction each time you increase how much of something you have.
This is easy to explain using ice cream as an example. As the price of ice cream falls, you buy more, but as it continues to fall, the same size drop in price doesn’t make you as likely to increase how much of it you buy – the impact the price drop has on your buying behaviour diminishes. You do not keep buying ice cream because it is cheaper, otherwise you become ill. Other factors also come into play, namely the determinants of demand and the elasticity of the price.
Elasticity of the price
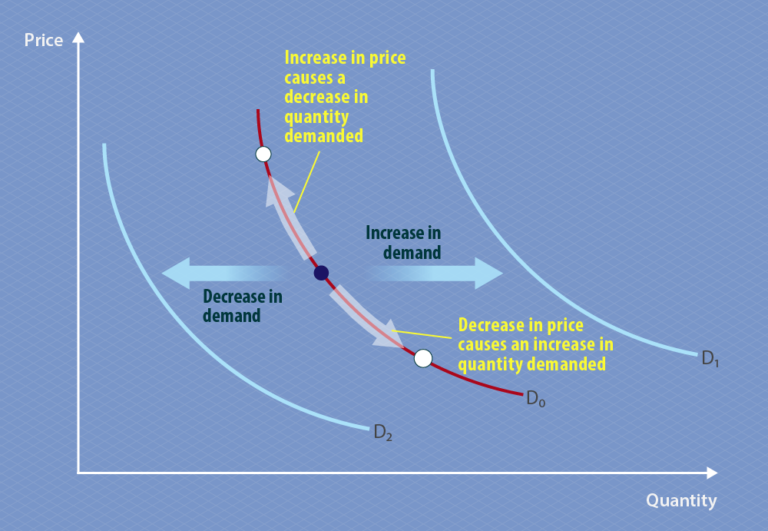
Elasticity is how sensitive demand is to a change in price. Some products, such as fuel, are very insensitive; if the price rises, it does not affect their level of demand. This is reflected in the angle of the slope of the curve – a steeper curve indicates goods/services that are less sensitive to changes in price. Finally, remember a change in price always moves along the curve.
Determinants of demand
The determinants of demand move the position of the demand curve either left or right.
Determinants of demand include:
- The consumer’s income level
- Prices of related substitutes or complementary goods
- Taste
- Fashion and trends
- Consumers’ expectations
These all move the curve negatively or positively, depending on how they affect demand. For example, if a consumer’s income falls, they spend less, so demand moves to the left. Fashion or trends move demand to the right as popularity of something increases, and to the left as something falls in popularity. Consumers’ expectations are particularly difficult to predict and can move the curve in either direction.
Looking at transport specifically, we need to realise that it is a derived demand. No-one buys transport for the joy of the journey; it’s to get somewhere or to do something. If you want to buy a large corner sofa, you’re going to have to have it delivered from the store. Even if you offer to collect it, you’ll have to pay someone or hire a vehicle of the right capacity to carry it. Transport is also time-specific, eg you want your sofa delivered when you are at home at a certain time, and this tends to make transport demand follow peaks and troughs: generally, everybody wants their delivery either early or late in the day.
References
Merriam-Webster (n.d.). Law of demand. https://www.merriam-webster.com/dictionary/law%20of%20demand


Reach your personal and professional goals
Unlock access to hundreds of expert online courses and degrees from top universities and educators to gain accredited qualifications and professional CV-building certificates.
Join over 18 million learners to launch, switch or build upon your career, all at your own pace, across a wide range of topic areas.


