
What Are the Different Long Lived Greenhouse Gases?
Carbon dioxide – CO(_2)
Sources and sinks
Carbon dioxide concentrations have risen by around 40% since the Industrial Revolution. Atmospheric mixing ratios for CO(_2) are now around 400 parts per million (ppm) compared to a pre‐industrial levels of 280 ppm. The global atmospheric CO(_2) budget is determined by several natural and anthropogenic sources and sinks (Table 1). The main ones are:
- Photosynthesis-respiration: Green plants are the biggest sink of atmospheric CO(_2) through the photosynthesis where absorbed CO(_2) from the atmosphere are used to produce carbon‐containing sugars. Almost all of the carbon from green plants is returned to the atmospheric CO(_2) pool through two processes: decomposition of organic matter in the soil by soil animals, bacteria, fungi, and other decomposer organisms (so called heterotrophic respiration) feeding on dead tissue and herbivores; and combustion in natural or human‐set wildfires.
- Atmosphere to ocean gas exchange: Atmosphere to ocean gas exchange is a physiochemical process, primarily controlled by the air‐sea difference in gas concentrations and the exchange coefficient, which determines how quickly a molecule of gas can move across the ocean‐atmosphere boundary. It takes about one year to equilibrate CO(_2) in the surface ocean with atmospheric CO(_2). The surface layer of the ocean, which is in contact with the atmosphere, is mixed by waves to a depth typically about 100m and although this surface mixed layer gradually equilibrates with atmospheric CO(_2), in most regions this does not mix easily with the deeper water masses. Hence the main rate‐limiting process for atmosphere to ocean CO(_2) exchange is not the airsea gas exchange, but the transfer of CO(_2) between the surface mixed layer and the deep water.
- Fossil fuels: When dead plants and animals slowly decay under high pressure and temperatures, they may eventually form coal, oil, and natural gas (fossil fuels) which is burned to release the energy stored in them. This source of CO(_2) which is around 7% of the natural respiration source has no balancing sink and is the main reason why CO(_2) concentrations have risen since the industrial revolution. Roughly 50% of all the carbon released as CO(_2) from fossil fuel burning and production has been absorbed by the oceans or the vegetation.
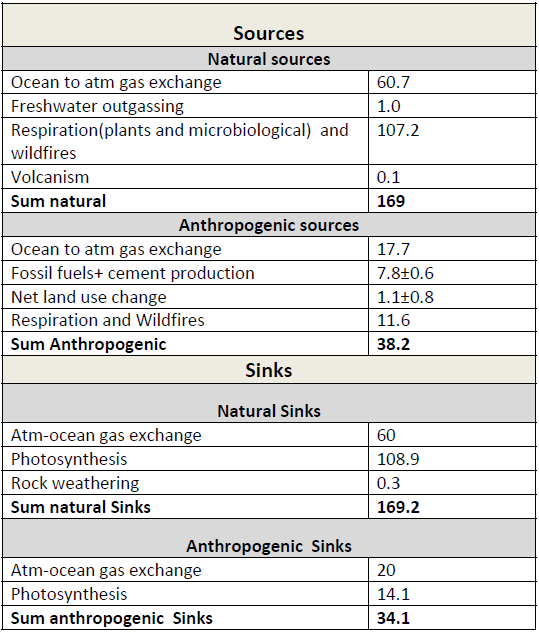 Table 1: Simplified schematic of the global atmospheric carbon budget (2000–2009 ) in PgC/yr). All values from Figure 6.1, IPCC AR5 WGI, chapter 6.
Instantaneous radiative forcing*
The instantaneous radiative forcing (W/m(^2)) from CO(_2) can be approximated as:
(RF_{co_2} = alpha ln(C / C_0))
Where (alpha = 5.35, CO_2) is the reference CO(_2)concentration (usually takes as 280 ppm) and C the CO(_2) concentration. C and C(_o) must be given in ppm (parts per million)
*A radiative forcing is an energy imbalance imposed on the climate system either externally or by human activities
Methane – CH(_4)
Sources and sinks
Methane is a strong greenhouse gas with an atmospheric lifetime in the order of 8‐10 years. Methane has a global warming potential (GWP) of 30. This means that every kilogram of methane emitted to the atmosphere has the equivalent forcing effect on the Earth’s climate of 30 times that of carbon dioxide over a 100 year period;
The global atmospheric CH(_4) budget is determined by several terrestrial and aquatic sources that can be broadly grouped into three categories:
* Biogenic: Biogenic sources contain CH(_4)‐generating microbes (methanogens), and consist of anaerobic environments such as natural wetlands and rice paddies, oxygenpoor freshwater reservoirs (such as dams), digestive systems of ruminants and termites, and organic waste deposits (such as manure, sewage and landfills).
* Thermogenic: CH(_4), formed over millions of years through geological processes, is a fossil fuel. It is vented from the subsurface into the atmosphere through natural features (such as terrestrial seeps, marine seeps and mud volcanoes), and through the exploitation of fossil fuels (coal, oil and natural gas).
* Pyrogenic: CH(_4) produced by the incomplete combustion of biomass and soil carbon during wildfires, and of biofuels and fossil fuels.
The sources are partly balanced primarily by one sink in the atmosphere: Oxidation of CH(_4) by hydroxyl radicals (OH), a process mainly taking place in the troposphere. This primary sink accounts for around 90% of the global CH(_4) sink. Additional oxidation sinks include oxidation in aerated soils (with oxygen) by methanotrophic bacterias, reactions with chlorine radicals and atomic oxygen radicals in the stratosphere, and reactions with chlorine radicals from sea salt in the marine boundary layer.
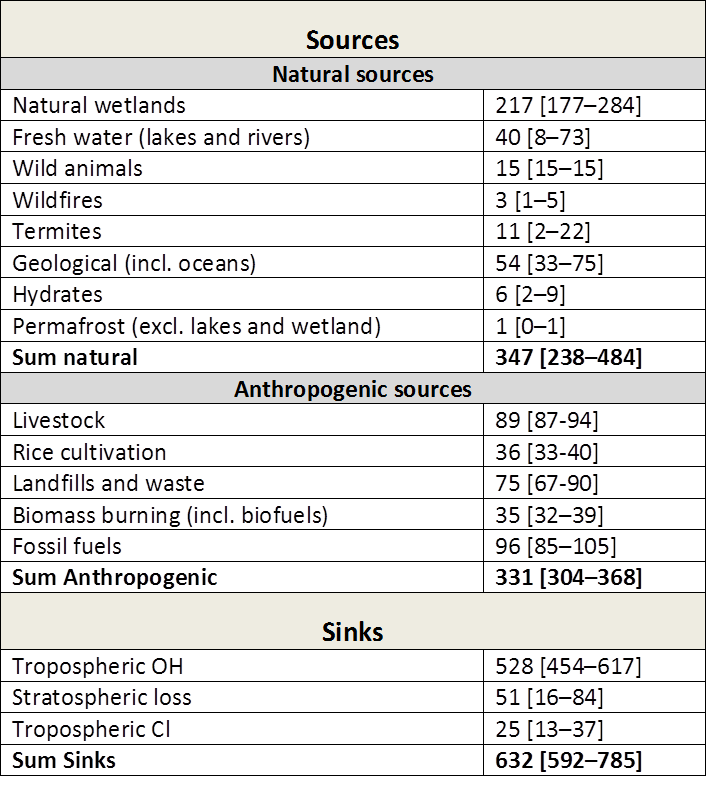 Table 2: Bottom‐up(^1) estimates of sinks and sources (2000‐2009) in Tg CH(_4)/yr. Numbers in square brackets represent minimum and maximum values in the literature. Taken from Kirschke et al. 2013. Note: The bottom‐up estimates cited here are around 20% larger than recent top‐down(^2) estimates. This is explained by a larger sum of natural emissions (from wetlands, freshwater, and geological sources) in the bottom up estimates.
(^1)The bottom‐up approach includes process‐based models estimating CH(_4) emissions, and CCMs estimating the OH sink. For wetland and wildfires CH(_4) emissions are parameterized with empirical knowledge of local processes and driven by global data sets of climate, or satellite‐observed burned area, to simulate CH(_4) fluxes. For anthropogenic sources emission inventories are often based on energy use, agricultural activity, and emission factors from different sectors. Three inventories for anthropogenic emissions are used in the above table.
(^2)Top‐down approaches are based on atmospheric inversion models, which determine ‘optimal’ surface fluxes that best fit atmospheric CH4 observations given an atmospheric transport model including chemistry, prior estimates of fluxes, and their uncertainties. Global atmospheric inversions provide a time‐varying distribution of CH(_4) fluxes, albeit with limited insight into the underlying processes when different sources overlap in the same region such as agricultural, waste and fossil emissions in densely populated areas.
Instantaneous radiative forcing
The instantaneous radiative forcing (W(^2)) from CH(_ 4) can be approcimated as:
(RF_{ch_4} = beta huge( small sqrt{M} – sqrt{M_0}huge) – [small f_{ch_4 leftrightarrow n_2O} (M, N_o) – f_{CH4 leftrightarrow N_2O} (M_o, N_o) huge])
(f_{ch_4 leftrightarrow n_2O} (M, N) = 0.47ln huge[ small 1-2.01×10^{-5}(MN)^{0.75} + 5.31×10^{-15} M(MN)^{1.52} huge])
Where (beta = 0.036, M_o) is the reference CH(_4) concentration and M the CH(_4) concentration. M and M(_o) must be given in ppb (parts per billion). (f_{ch_4 leftrightarrow N_2O}(M, N)) is the correction term for overlapping absorption bands with N(_2O), N and N (_o) are N(_2)O concentrations in ppb
Nitrous Oxide – (N_2O)
Sources and sinks
Nitrous oxide is a powerful greenhouse gas produced both naturally and via human activities. Its concentration in the Earth’s atmosphere has risen by around 15% since the Industrial Revolution. Atmospheric mixing ratios for nitrous oxide now stand at around 315 parts per billion (ppb) compared to a pre‐industrial high of 275 ppb.
Nitrous Oxide is a greenhouse gas with an atmospheric lifetime of 118‐131 years. N(_2)O is a much more effective greenhouse gas than carbon dioxide having a Global Warming Potential of 298 over a 100‐year time span. This means that one kilogram (kg) of N(_2)O released into the atmosphere has a global warming effect equivalent to 298 kg of carbon dioxide over a 100 year period.
Natural sources of N(_2)O include emissions from the ocean, oxidation of ammonia in the atmosphere and from nitrogen in soils, particularly tropical soils:
* Soils under natural vegetation: The largest natural source of nitrous oxide is from soils under natural vegetation. Uncultivated soils make up the majority of the Earth’s land surface and the nitrous oxide produced by microbes that break down nitrogen in these soils are the main natural source of atmospheric (N_2O) (produces around 60% of natural emissions) . Riparian (close to water) and tropical rainforest soils are important contributors to this source because they have higher nutrient availability and moisture levels.
* Oceans: The oceans are believed to be one of the largest natural sources of (N_2O) emissions here (N_2O)is produced as an intermediate during microbial denitrification (reduction of (NO_3)– to (N_2)) and as well as a by‐product during nitrification (oxidation of (NH_4^+) to (NO_3^-)). For example denitrification by ingested bacteria in the anoxic animal gut or in and around sinking fecal pellets from zooplankton which provide the anaerobic conditions necessary for denitrification, a process which produces nitrous oxide as a by‐product.
* Synthetic fertilisers: The main source of anthropogenic Nitrous Oxide is use of synthetic fertiliser and manure applications which increase the production of (N_2O)in soils and sediments, via nitrification and denitrification pathways, leading to increased (N_2O) emissions to the atmosphere. Increased emissions occur not only in agricultural fields, but also in aquatic systems after leaching of fertilizers and runoff, and in natural soils and ocean surface waters as a result of atmospheric deposition of nitrogen originating from agriculture, fossil fuel combustion and industrial activities. Food production is likely responsible for 80% of the increase in atmospheric (N_2O), via the addition of nitrogen fertilisers.
The major sink for atmospheric (N_2O) is destruction in the stratosphere where the majority undergoes photolysis to (N_2) + O. The remaining (N_2O) reacts with O to produce NO, which can enter into a stratospheric ozone‐depleting reaction cycle. Thus, (N_2O) , like many halogencontaining gases, is important both as a greenhouse gas and as an ozone‐depleting substance.
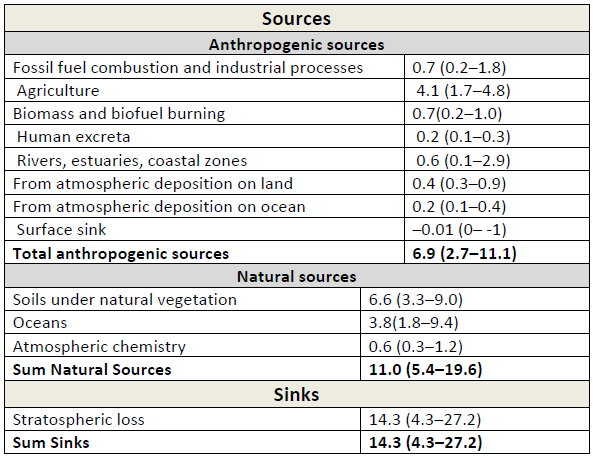 Table 3: Global (N_2O) budget for the year 2006. Unit: Tg((N_2O)‐N) yr–1. All values taken from IPCC AR5, WGI, chapter 6
Instantaneous radiative forcing
The instantaneous radiative forcing (W/m(_2)) from N(_2)O can be approximated as:
(RF_ {N_2O} = varepsilon huge( small sqrt{N} – sqrt{N_0} – huge [ small f_{CH_4 leftrightarrow N_2O} (M_0, N) – f_{ch_4 leftrightarrow N_2O}(M_0, 0) huge])
(f_{ch_4 leftrightarrow N_2O}(M_0, 0) (M, N) = 0.47ln huge[small 1 + 2.01X10^{-5} (MN)^{0.75} + 5.31×10^{-15}M(MN)^{1.52}huge])
Where (varepsilon = 0.12, N_o) is the reference N(_2)O concentration and N the N(_2)O concentration. N and N(_o) must be given in ppb (parts per billion). (int {CH_4 leftrightarrow N_2O}(M, N)) is the correction term for overlapping absorption bands with CH(_4). M and M(_o) are CH(_4) concentrations in ppb.
Halogenated Species
Halogenated species are gases that contain fluorine (F), chlorine (Cl), bromine (Br), iodine (I), or astatine (At) and can be powerful greenhouse gases (GHGs). Those containing chlorine and bromine also deplete stratospheric ozone. Most of those compounds do not have natural emissions and, because of the implementation of the Montreal Protocol and its amendments, total emissions of chlorine and bromine compounds have sharply decreased since the 1990s. Their concentration of their substitutes (hydrochlorofluorocarbons (HCFCs) and hydrofluorocarbons (HFCs)) has risen over the recent past.
Carbon monoxide and volatile organic compounds
Emissions of carbon monoxide (CO) and volatile organic compounds (VOCs) lead to production of ozone on short time scales. By affecting OH and thereby the levels of CH4 they also initiate a positive long‐term ozone effect. CO has a lifetime of 2 to 3 months. The effects of VOCs via ozone and CH4 cause warming and the additional effects via interactions with aerosols and via the O(_3)–CO(_2) link increase the warming effect further.


Reach your personal and professional goals
Unlock access to hundreds of expert online courses and degrees from top universities and educators to gain accredited qualifications and professional CV-building certificates.
Join over 18 million learners to launch, switch or build upon your career, all at your own pace, across a wide range of topic areas.


