
Using Reports and Charts in Genealogy
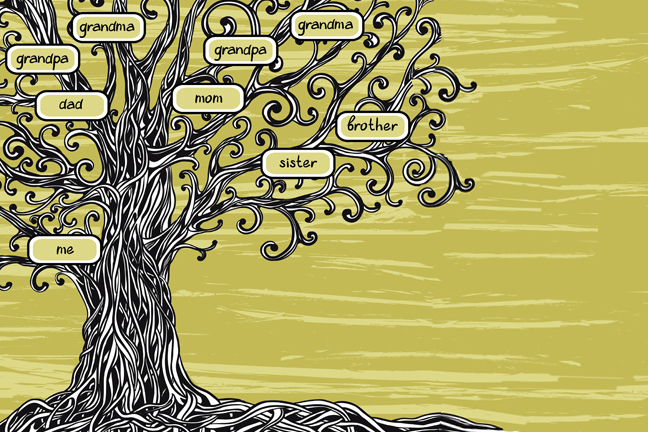
In this article, we are going to look at different types of reports and charts used in genealogy and consider which type might be best for a particular need or situation. We’ll also discuss some conventions that are used to represent relationships in these tools.
Charts are graphical representations of family trees using some symbols to illustrate principal components, while reports are structured, ‘readable’, text-based displays of genealogical information. Charts give an easy way to appreciate the overall structure of a family while reports can be used to provide all the information that is known, or to focus on specific people or certain family relationships.
Charts The two most common charts are ancestor (or pedigree) charts and descendant charts.
An ancestor (or pedigree) chart starts with you, or some specified person, and moves back through the generations of ancestors. The generations can be displayed vertically or horizontally.
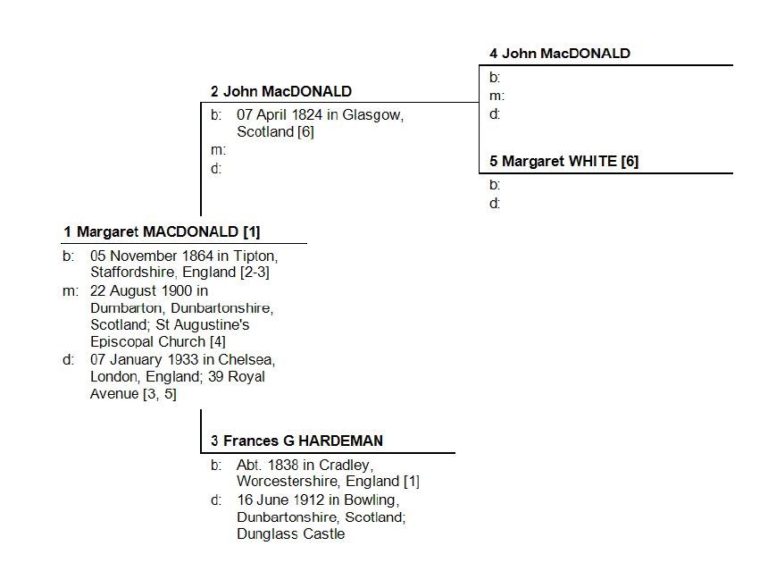
An example of a horizontal pedigree chart which shows the starting person on the left hand side and their ancestors displayed to the right. Typically, people are numbered on these charts and are allocated a unique number. This chart generally shows only direct ancestors – there is no room for siblings, and strict adherence would not show multiple marriages.
Ancestor charts are often collected by many family history societies as the record for members’ ancestry. An ancestor chart displays several generations of family data on a single page, and some paper charts will accommodate as many as 15 generations. They can also be easily created as an output from family history software.
A descendant chart (also called a drop-line chart) starts with you or an ancestor or another individual in a family tree and lists all of the descendants of that person coming down through the generations.
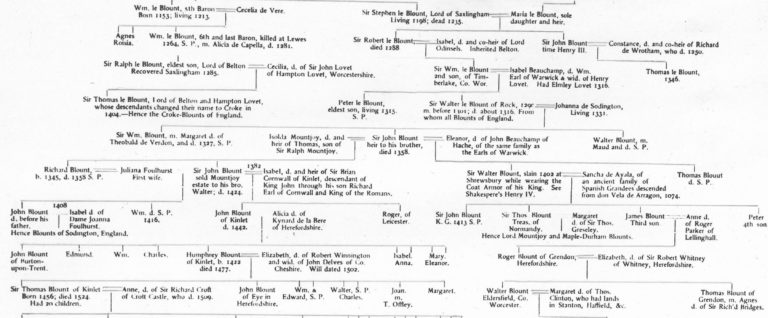
An example of a descendant chart showing all children in each generation with spouse names where known. This tree was created in 1902 by H.M.H. Prescott for the BLOUNT and BLUNT family line and just a small bit of the tree is shown here (this snippet can be downloaded by following the links at the end of the page). Descendant charts often begin with the earliest proven ancestor in a line. These are most often used to chart all the descendants that can be found of a specific ancestor – often an immigrant or the first one living in a specific area or country.
Creating charts There are many free to use blank downloadable ancestor chart forms on the Internet which are very useful. Some sources for these can be found in the ‘See Also’ section.
For descendant charts, if you are creating these by hand, these charts are usually done once enough research has been done to identify siblings and a good number of generations. These charts are often easier to create (and change) using software tools.
Of course you can just sketch out family trees by hand on paper and doing this is a good way to quickly understand family connections. Use a pencil to do this so you can more easily make changes. Genealogical software packages can be quite limiting in how they represent family trees in charts so you may want to try using other types of software such as a word processing or desk top publishing tool to ‘draw’ a tree. This might be particularly helpful if you need to show relationships such as adoption, illegitimacy and so on. See the article on adoption in the ‘See Also’ section for further ideas.
Reports Two reports that correspond to ancestor and descendant charts are the ancestor (or Ahnentafel, German for ‘ancestor table’) report and the descendant report. These can be created through the use of genealogical software or written ‘freehand’.
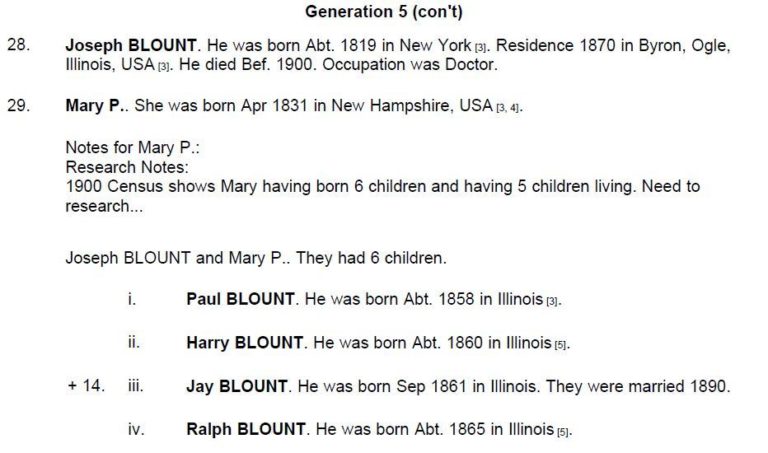
An ancestor report starts with you, or some specified person, and moves back through the generations of ancestors and can list many different types of data and when output from genealogical software packages can easily include information on siblings as in this example below. You can see here that not only is birth, marriage and death information included but we see occupation and residence facts being shown.
The numbering system used on ancestor reports and ancestor charts is the same and this means you can match up people quite easily.
The Family Group Sheet is another common type of descendant report. It carries data covering three generations of a family (parents, their children and the parents’ parents) so is ideal for data capture, but is also good for display because:
- a researcher quickly can see what information is in hand and what is missing
- information can be exchanged easily with other researchers
- it is more flexible, and contains more information, than graphical charts or trees.
Again, there are many free to use blank downloadable family group sheets on the Internet and these can also be created from genealogical software populated with the data on your family that you have entered into the software. We have provided the family group sheet used with our courses at the University of Strathclyde in the ‘See Also’ section below which you can download and use freely.
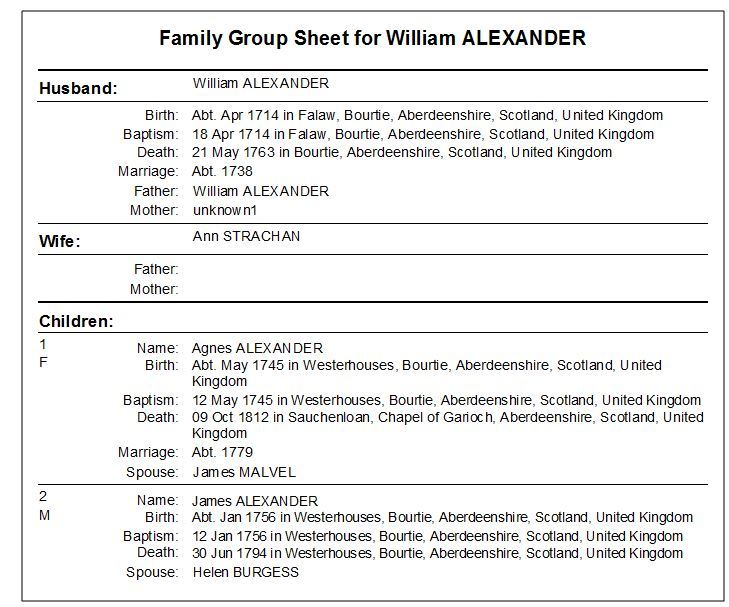
This family group sheet was created by genealogical software but the concept is the same as the paper based forms as it includes information on three generations.
Common conventions on charts and reports
- an = mark denotes a married couple. Example: William Blount = Julia Herrick
- proved ancestral links are shown with a line, those that are conjectural are shown with a dotted line.
- illegitimate children are often shown by dashed lines decending from the known parent or parents. Dashed lines – – – are also often used to show ‘non-marriage’ relationships. Example: William Blount – – – – Elizabeth Wonder
- question marks are used to show that the information is in question. Example: born 1846?
- use b. for born, c. or bp. for christened or baptized and bur. for buried. Example: bp. 6 November 1945.
Dates If you only have an approximate date for an event, add “about” (abt.) or “circa” (ca. or c.) before the date. Examples: c. 1851, ca. 1873, abt. Nov 1881.
You can use before (bef.) or after (aft.) a specific date; for example when you know someone was still living at some time, or was born after a certain date Examples: aft. 12 Jan 1880; bef. 9 Apr 1881
There are many other conventions and these include those to do with recording names and places.


Reach your personal and professional goals
Unlock access to hundreds of expert online courses and degrees from top universities and educators to gain accredited qualifications and professional CV-building certificates.
Join over 18 million learners to launch, switch or build upon your career, all at your own pace, across a wide range of topic areas.


