This course is part of the Programming Essentials with Python ExpertTrack
Programming Essentials with Python: Matplotlib and Seaborn
Explore the fundamentals of object-orientated programming languages and learn how to visualise data with Python.

Duration
4 weeksWeekly study
4 hours100% online
How it worksIncluded in an ExpertTrack
Course 3 of 3
Programming Essentials with Python: Matplotlib and Seaborn
The third part of this introduction to Python and programming ExpertTrack will teach you the core principles of data-visualisation libraries.
You’ll learn to define object-oriented programming, explore the key components of visualising with Python and the tools that can be leveraged.
You’ll also explore other Python libraries and their uses, learning how to define and compare them.
Learn how to use Matplotlib in Python
Matplotlib is a multi-platform plotting library for Python. It allows you to produce quality 2D charts in just a few lines of code.
The course will take you through the basics of the Python Matplotlib package, from its objects to its architecture, and you’ll learn how to create static plots using the library.
Understand how to use the Seaborn library for data visualisation
Seaborn is a Python data-visualisation library based on Matplotlib that provides a high-level interface for drawing statistical graphics.
You’ll examine the architecture and objects of the Seaborn package, learning how to use it to create static visualisations and customise Seaborn plots.
Explore the basics of object-oriented programming languages
Object-oriented programming (OOP) is a method of structuring a program by bundling related behaviours and properties into individual objects.
This course will introduce you to the core principles of OOP. It will teach you how to articulate object-oriented programming and how it relates to the Python language.
Upon completion of this third course within the Python Programming Essentials ExpertTrack, you will be able to differentiate between various types of cloud architecture, speak fluently to tech teams about Python options and applications, and complete basic tasks using Python.
Syllabus
Week 1
Introduction to the Matplotlib library in Python


Welcome to the course!
We will go through an introduction to the course, information about the optional project tasks, and an overview of Week 1.

Introduction to Matplotlib
This activity will provide you with some of the basics needed to get started with the Matplotlib library. This includes how to create a figure and axes, plotting specific functions, and customising the graphs you produce.

Plotting time series data using Matplotlib
In this activity, we learn about how to plot time series data using Matplotlib. This is useful to normalise time data and parse this information correctly.

Quantitative comparisons and statistical visualisations
In this activity, we discuss some of the types of quantitative comparisons we can create using Matplotlib. We will analyse bar charts, histograms, and scatterplots in detail, specifically.

Wrap-up
This activity is a summary of Week 1's learnings.
Week 2
Sharing your content and Seaborn in Python

Welcome to Week 2
Welcome to Week 2: Sharing you content and Seaborn in Python

How to share visualisations
In this activity, you will learn how to share your plots in an appropriate manner ensuring that all elements of a plot are easily visible. By the end, you should have a good grasp of how to perform this operation.

Introduction to Seaborn
In this activity, we will learn about Seaborn. We will learn about what the Seaborn module is capable of and when the best time is to use it. We will also discuss how Pandas can be used with Seaborn.

Visualising two quantitative variables
In this activity, we will discuss how relational plots and subplots work, and further develop our skills for scatter plots. An introduction to line plots will also be provided.

Visualising categorical and quantitative variables
In this activity, we will talk about the various plots you can use to visualise your categorical and quantitative data. This will cover count plots, bar plots, box plots, and point plots.

Customising Seaborn plots
In this activity, we will discuss how to customise the plots you create within Seaborn. This includes learning how to change the colours and adding important features such as titles and labels to the plots.

Wrap-up
In this activity, we will summarise what we've learned in Weeks 1 and 2.
Week 3
Object-orientated programming

Welcome to Week 3
Welcome to Week 3: Object-oriented programming

Object-orientated programming
This activity will be an introduction to object-orientated programming. It will provide you information about how objects work, how to define classes, and what instances are. We will also talk about some basic Python libraries.

Wrap-up
Week 3 wrap-up
Week 4
Python additional libraries

Welcome to Week 4
Welcome to Week 4: Python additional libraries

Python libraries
Using libraries is paramount to programming in an object-orientated language. In this activity, we will discuss some of the most popular libraries that might be useful to you, along with examples to illustrate their use.

Wrap-up
This is a short summary of the final two weeks of the course and what you have learned.
Prove you're job ready
Highlight the new, job-relevant skills you’ve gained and supplement existing qualifications with a hard-earned, industry-specific digital certificate – plus one for every course within your ExpertTrack.
- Learn the latest in your chosen industry or subject.
- Complete each course and pass assessments.
- Receive certificates validated by the educating organisation.
- Impress employers with learning outcomes you can add to your CV.
- Make your career dreams a reality.
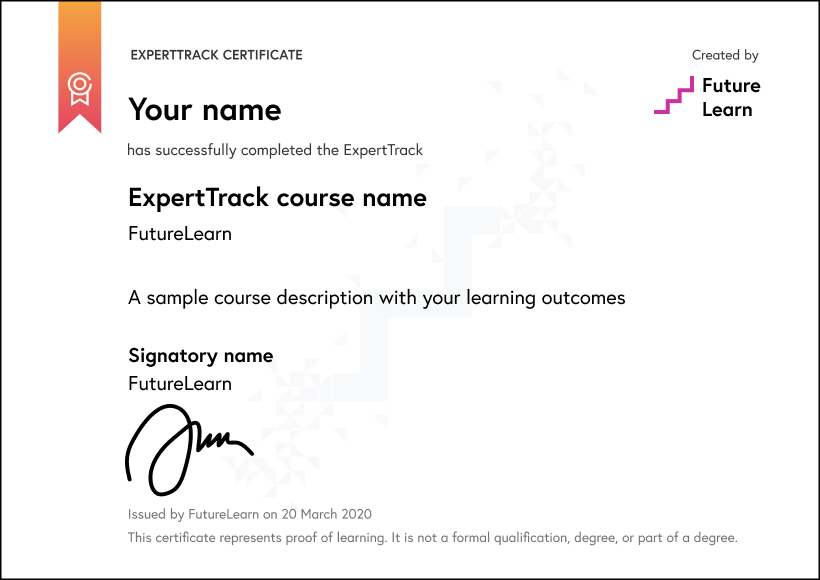
Download a PDF
Learning on this course
On every step of the course you can meet other learners, share your ideas and join in with active discussions in the comments.
What will you achieve?
By the end of the course, you‘ll be able to...
- Define object-oriented programming
- Define a class in Python
- Identify key components of visualising using Python and tools that can be leveraged
Who is the course for?
This course is designed for professionals looking to build confidence in Python and other programming languages.
It’s ideally suited to career-changers seeking a programming role, established technology professionals, and tech team leaders.
What software or tools do you need?
On this course we’ll be using Python. We recommend you use a computer to access these elements.
Who will you learn with?

Hi everyone. I'm Jey, a professional accredited engineer that is looking to create innovations inside the engineering industry. My interests include deep learning, cryptography and quantum computing.
Who developed the course?

FutureLearn
FutureLearn is a leading social learning platform and has been providing high quality online courses for learners around the world over the last ten years.
In collaboration with

Endorsers and supporters
endorsed by


Start learning today - free 7-day trial
After your free trial you can:
- Pay $39 per month to keep learning online
- Have complete control over your subscription; you can cancel any time
- Work at your own pace and set your own deadlines at every stage
- Only pay while you’re learning; the subscription will cancel automatically when you finish
- Complete online assessments to test your knowledge and prove your skills
- Earn digital course certificates and a final award that you can share online, with potential employers, and your professional network
- Keep access to the content of courses you complete even after your subscription ends
Learning on FutureLearn
Your learning, your rules
- Courses are split into weeks, activities, and steps to help you keep track of your learning
- Learn through a mix of bite-sized videos, long- and short-form articles, audio, and practical activities
- Stay motivated by using the Progress page to keep track of your step completion and assessment scores
Join a global classroom
- Experience the power of social learning, and get inspired by an international network of learners
- Share ideas with your peers and course educators on every step of the course
- Join the conversation by reading, @ing, liking, bookmarking, and replying to comments from others
Map your progress
- As you work through the course, use notifications and the Progress page to guide your learning
- Whenever you’re ready, mark each step as complete, you’re in control
- Complete 90% of course steps and all of the assessments to earn your certificate
Want to know more about learning on FutureLearn? Using FutureLearn


