How to clean your data using Excel
In this guest post from Filtered, we take a look at how you can deal with a dirty dataset, giving tips on how to clean your data with Excel.

Do you know what comes before data analysis? Data integrity. Well, it should anyway. Because if your data is rubbish, then your analysis will be.
Before you can do any analysis with a dataset, it should be correct, consistent, and complete. Otherwise, you could end up with a Kodak moment. Not the good kind, the $11m mistake kind.
Here are a few tips for dealing with a dirty dataset.
Removing Duplicates
One of the most common challenges with data is duplicates. Dealing with duplicates can be straightforward. But before we start, it’s a good idea to take your dataset and make a copy. Deleting data is permanent, so it’s always safer to keep a copy of what you started with.
Now, if your dataset is full of duplicates rows, you can highlight the entire dataset and navigate to the Data tab in the Excel ribbon. There, you can click remove duplicates and, voila – Excel will delete duplicate values so that only the first remains. Many of us are familiar with that process, but we think you should take a step back and do some due diligence before removing duplicates.

Two rows may share many values but be separated by others. Take this example:
In a dataset containing membership contact details, two rows may contain the same email address, but the names in each row are different.
There are a couple of different scenarios that may explain this.
- The names are of two family members who share an email address, but are of course two distinct people – two members.
- It’s one person who has input two different variations of their name—Bob and Robert, for example. Or perhaps a simple typo – Robert and Roebrt.
If we’ve selected the whole dataset, Excel doesn’t see these rows as duplicates. So we could end up with excess data, giving false impressions about the number of members.
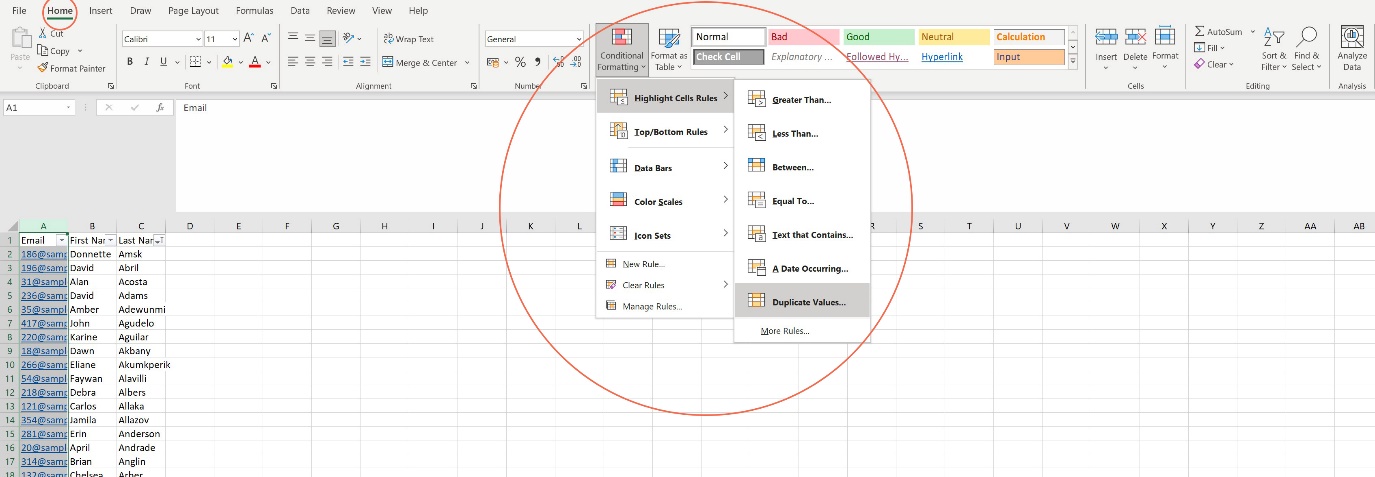
So how do we account for things like this? Well, one way is conditional formatting. We could highlight a column – let’s say the ‘email’ column – then Navigate to the ‘Home’ tab on the ribbon, and click the ‘Conditional Formatting’ dropdown. Hover over ‘Highlight Cell Rules’, then click ‘Duplicate Values’.
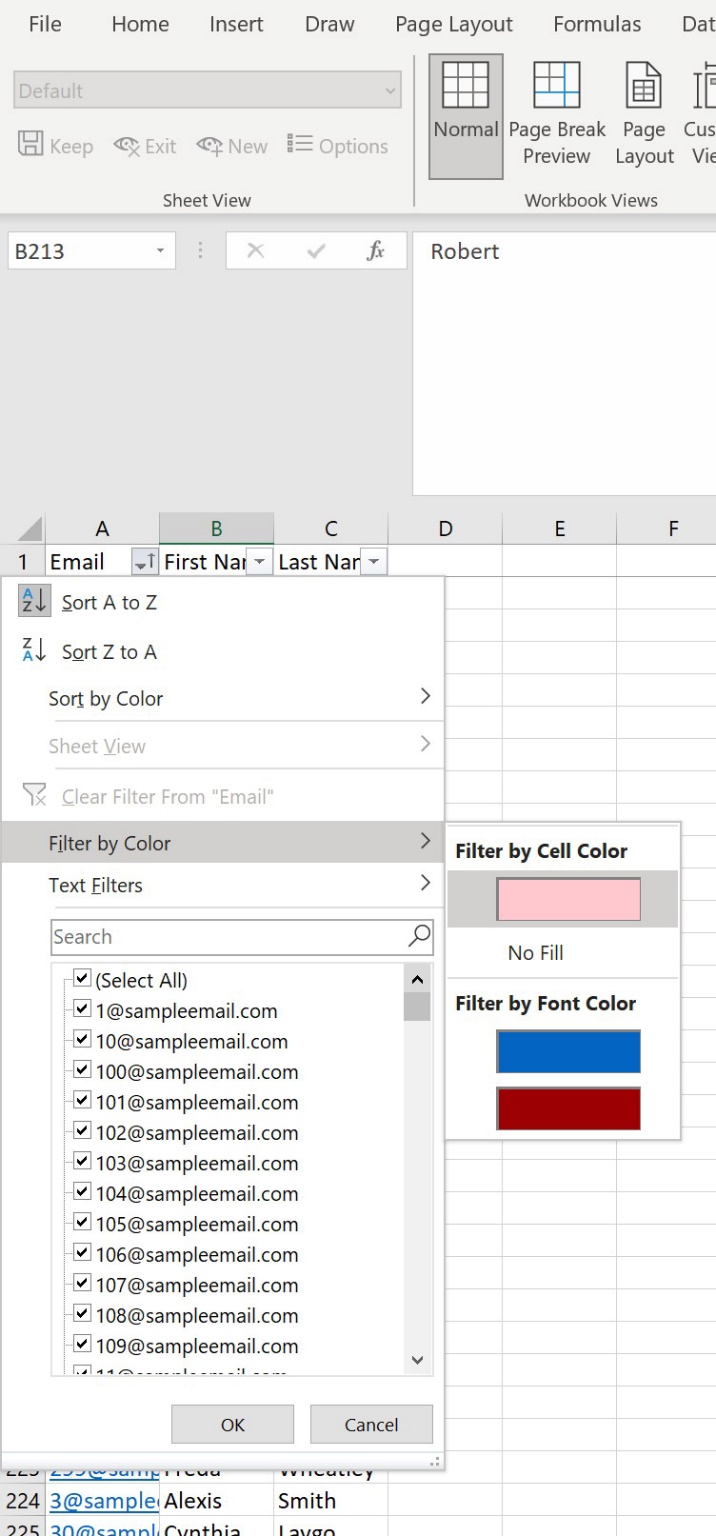
Now, select Data > Filter from the excel ribbon. Click the down arrow in the heading of the ‘email’ column, then Filter by colour, specifically the colour used to highlight duplicate values. You’ll be left with the duplicate emails, and can spot check for similarities and differences between rows before choosing which duplicates need removing.
If text contains
Sometimes when we have a dataset, we want to look for something that links cells. An example might be displaying contacts with specific email domain extensions – ‘.co.uk’ and ‘.org.uk’ for example.
An easy, effective way to do this is with filtering. While sitting in your column heading, go to the Data tab of the Excel ribbon, and click the Filter button. There is an option for Text Filters – hover over it, and select the ‘Contains…’ option.
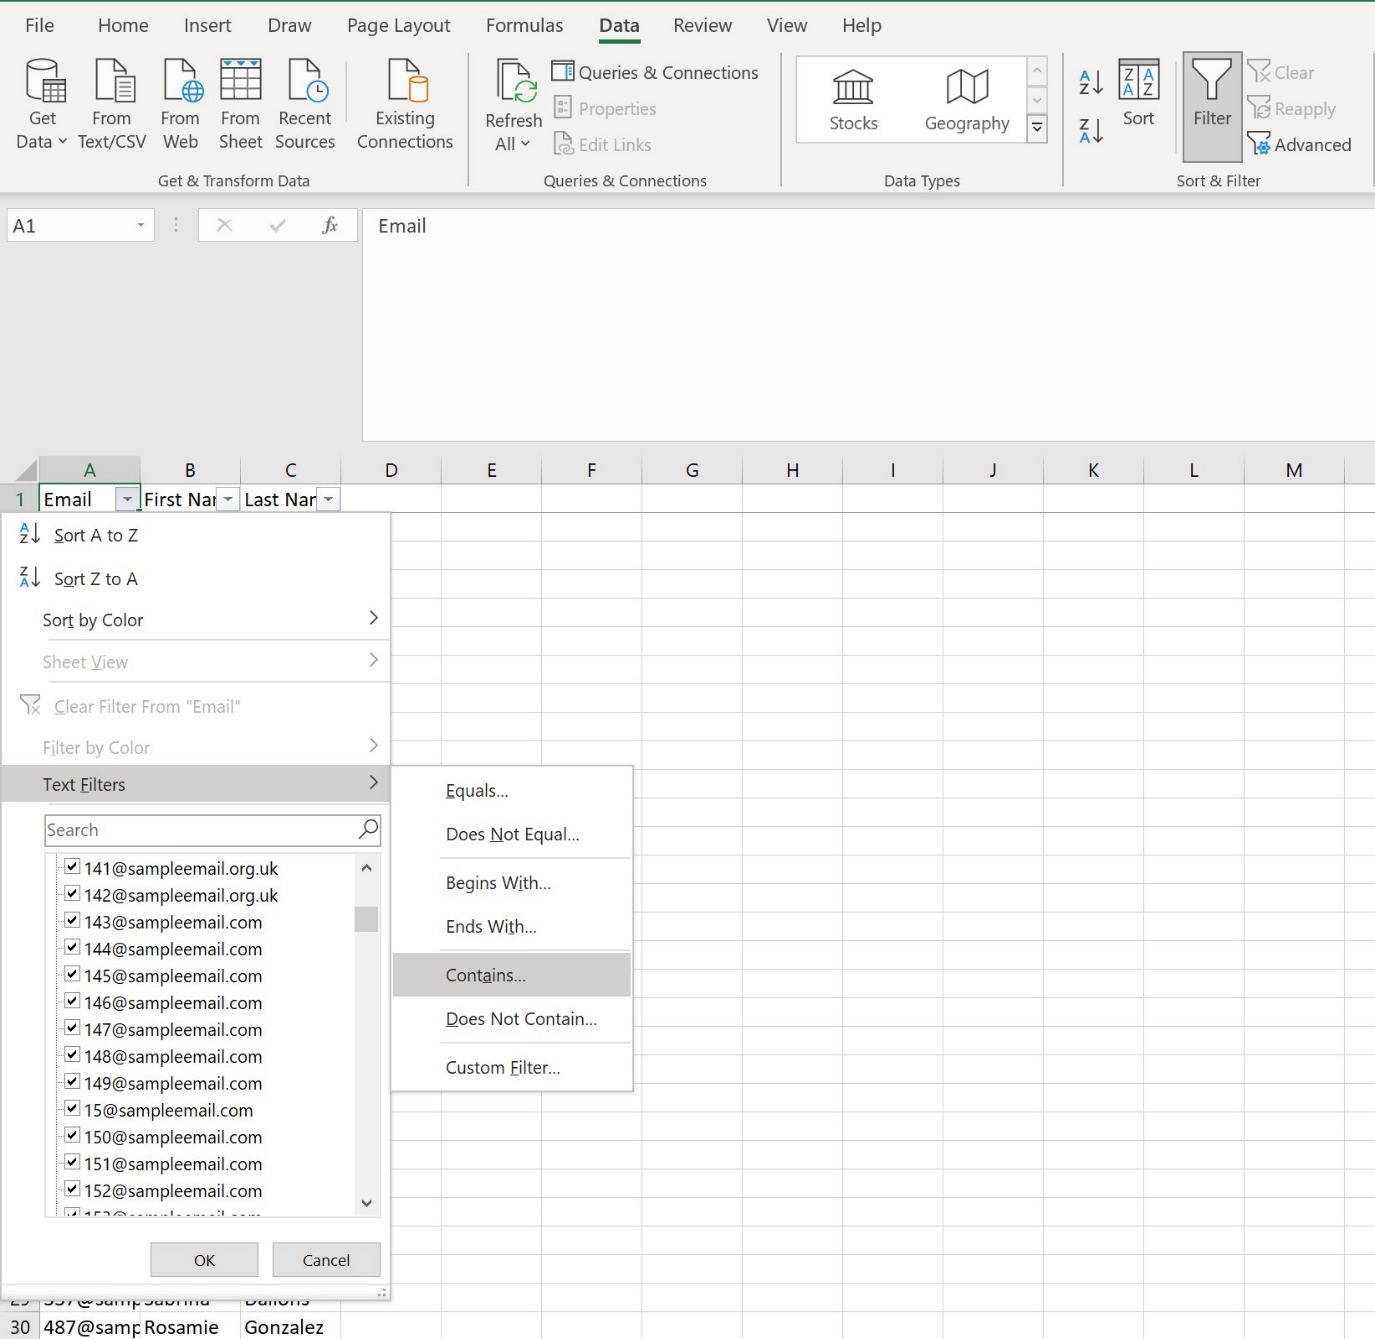
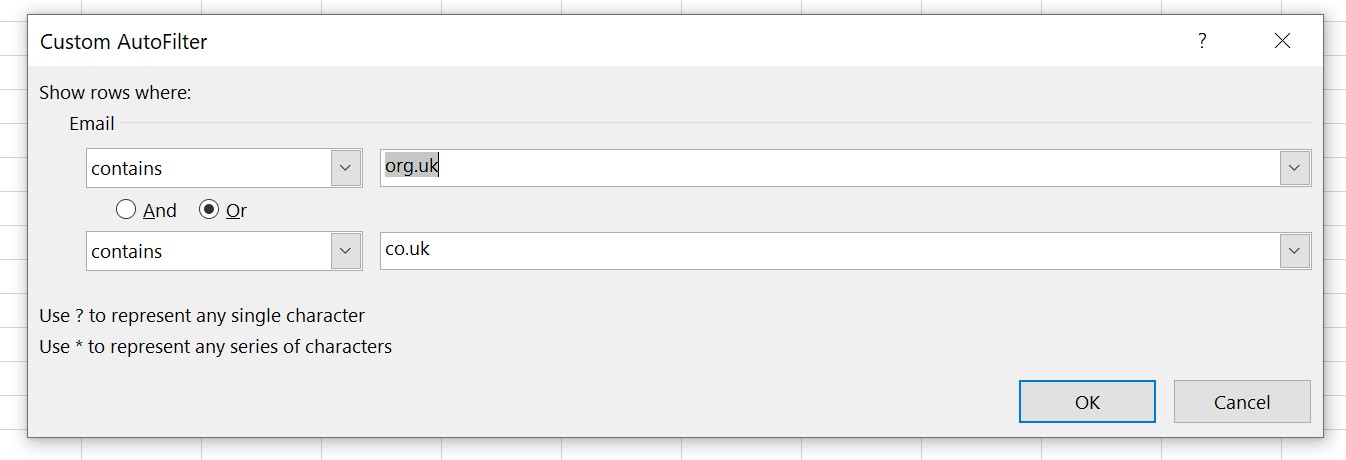
Make sure to pick the right option – here; we are looking for ‘org.uk’ OR ‘co.uk’.
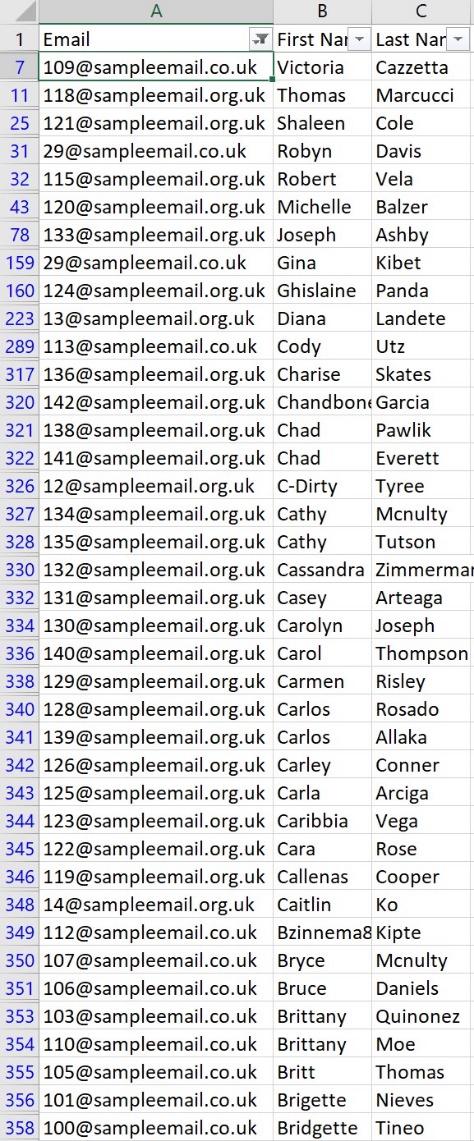
We selected contains from the dropdowns, and these were the results. There are other very useful options aside from ‘contains’ too, though. For example, if you wanted to filter certain results from a column of payments, you could use ‘greater than or equal to’ to find payments over a certain threshold.
If you want to search for values within a cell and return values, Dave Bruns over at ExcelJet has an excellent formula for just that.
MIN/MAX
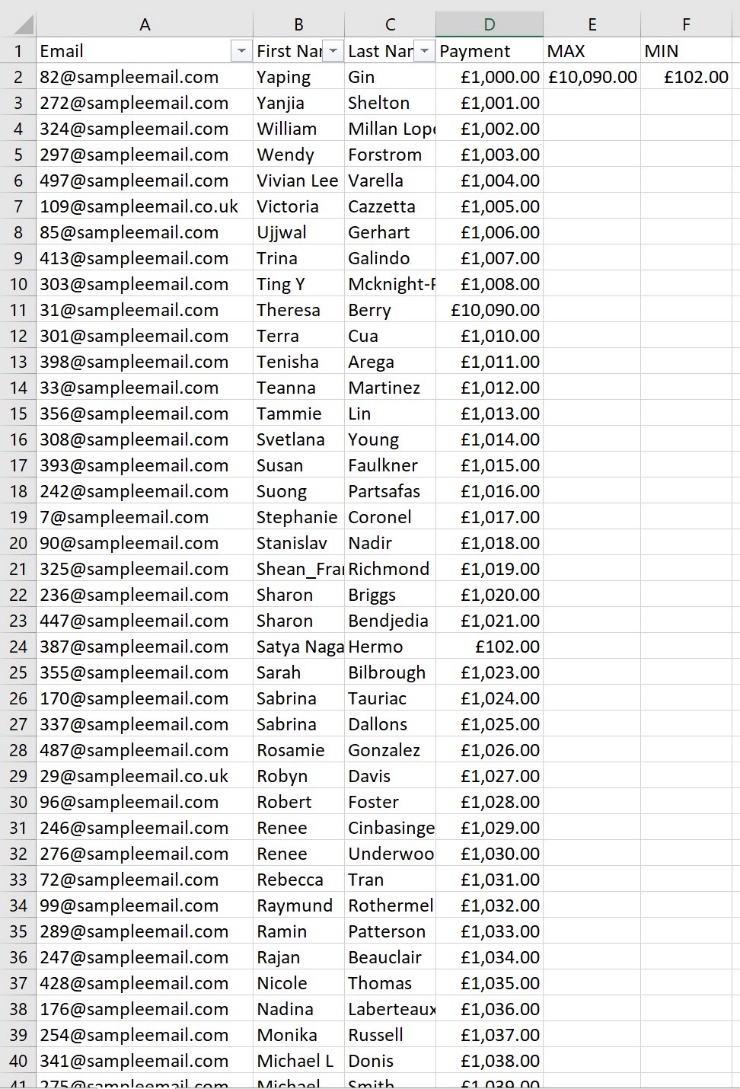
Another extremely handy technique to use when cleaning data is to search for outliers in values using MIN/MAX. The classic mistake that Kodak fell victim to was adding too many zeros to a particular severance accrual record, resulting in an $11 million overstatement. It’s almost impossible to spot such errors in a vast database with the naked eye, but with the MAX function, you can return the largest value in a dataset, thus catching errors that would have otherwise gone unnoticed.
On the other hand, you may want to ensure nobody has made an underpayment, which is where MIN comes in. Working in much the same way, MIN simply returns the smallest value in a search area.
In the example below, we were able to discover both a significant overpayment and a similarly serious underpayment by searching the payment column:
In cell E2, we input the formula =MAX(D:D)
In cell F2, we input the formula =MIN(D:D)
Splitting Text to Columns
Another popular technique used in data cleaning is the text to columns wizard. If your spreadsheet contains a column in which the cells contain lists of items, you may want to put each item into its own cell.
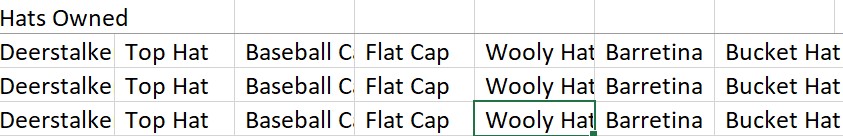
In the example below, we’ve added a column whose cells list hats owned by each person.
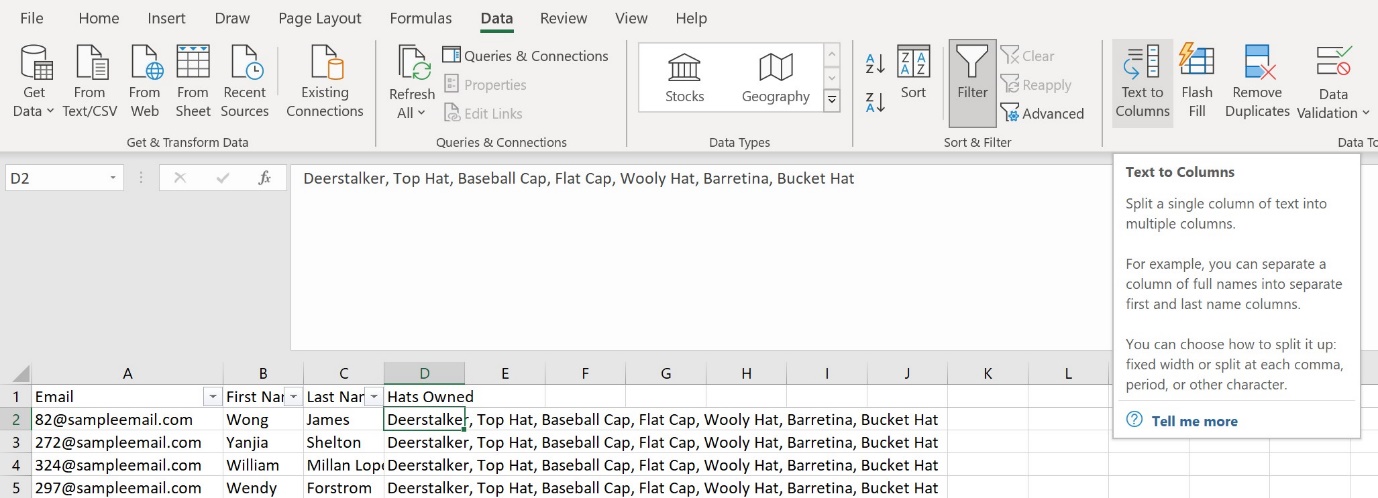
Highlight the area you’d like to split – in this case, the whole of Column D. Hop over to the Data tab in the Excel Ribbon once more, and click the Text to Columns button (as shown above).
As all of our list items are separated by commas inside the cell, that is what is called our delimiter. So, as below, choose ‘Delimited’, and click next.
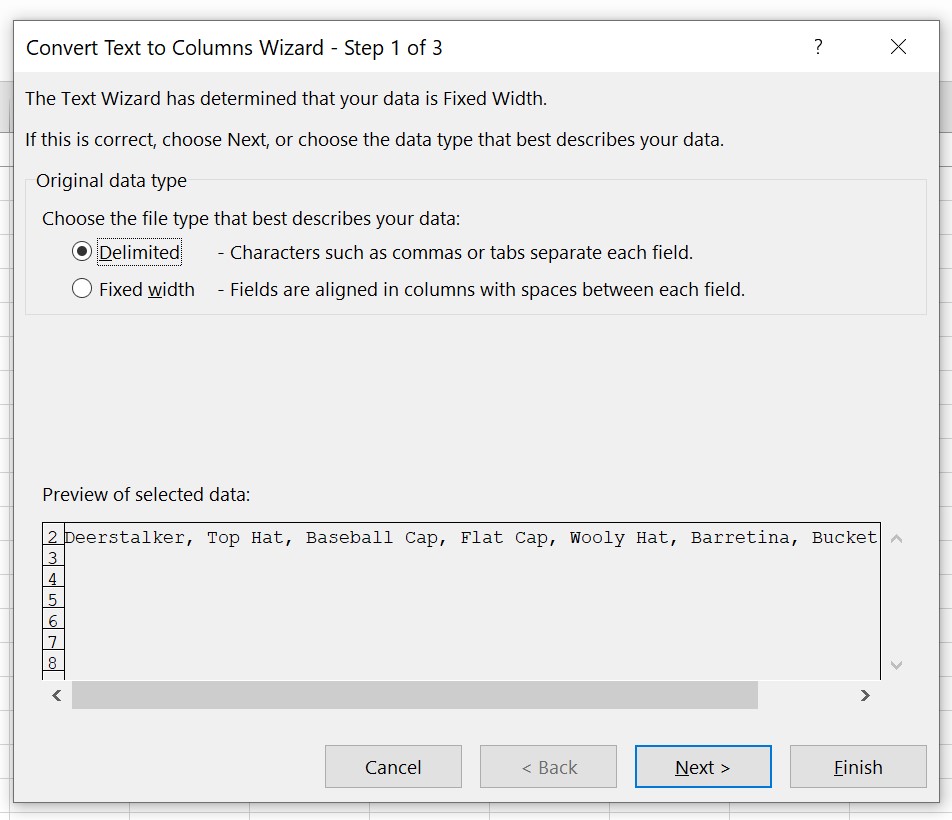
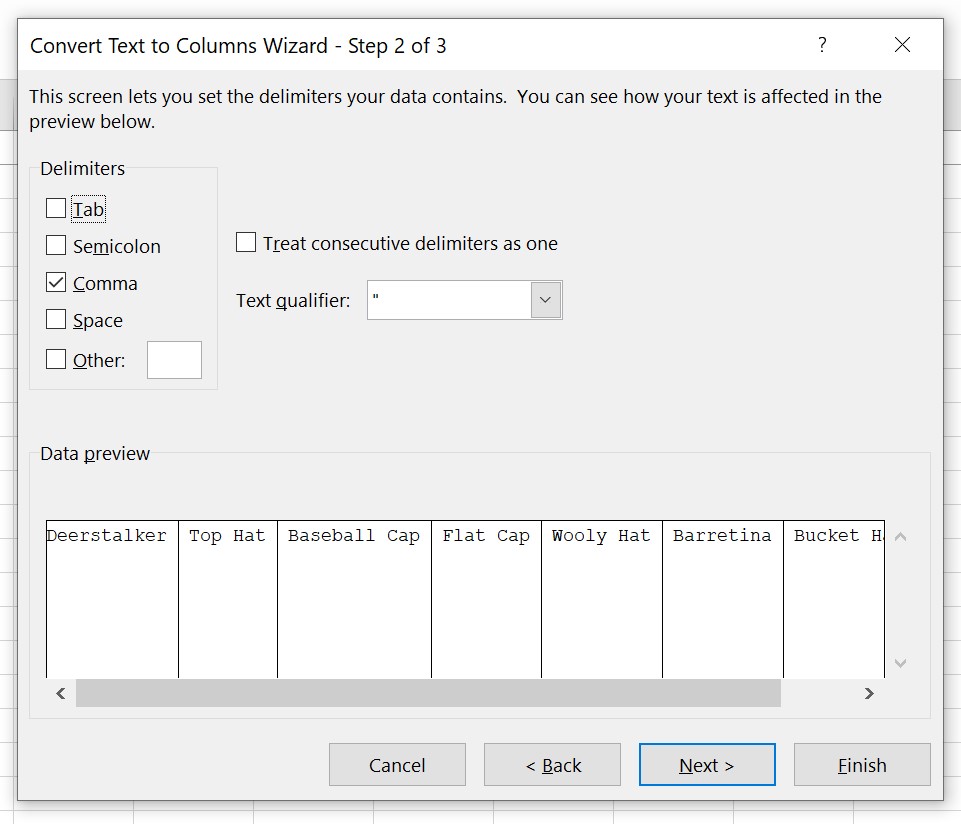
Now, ensure the correct delimiter is selected. For us, it’s a comma, so we check that box. If you’re happy with the preview, click next again.
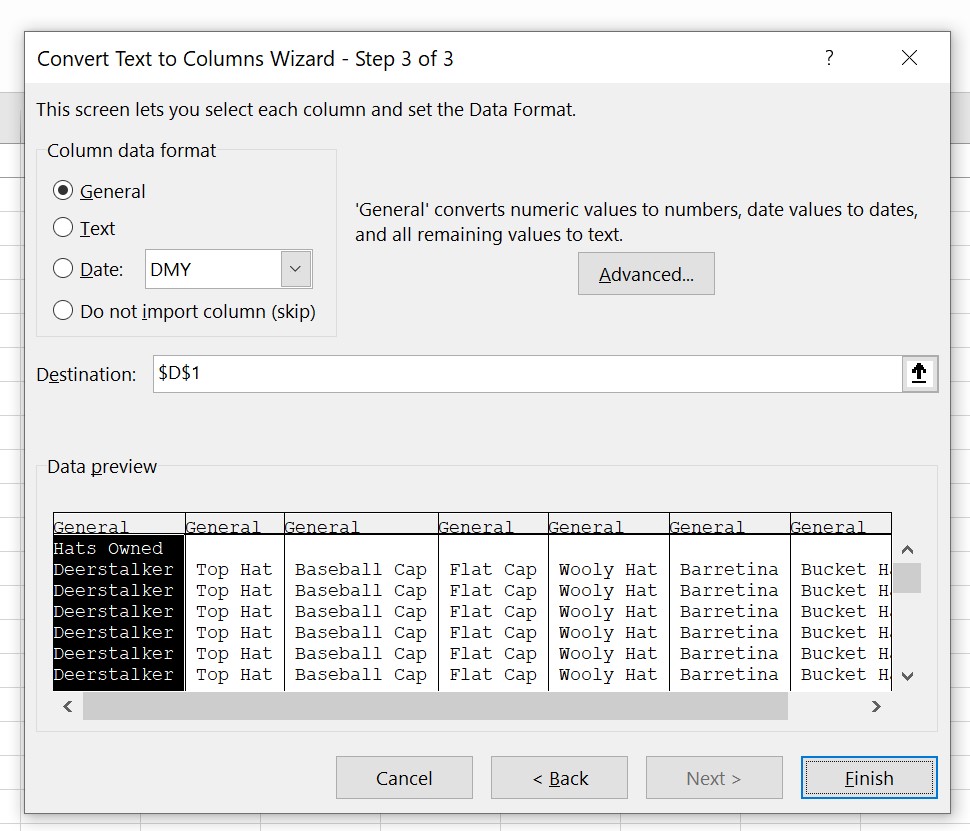
Usually, leaving the column data format as General is just fine. So now, you just need to click finish, and you are done.
Concatenate
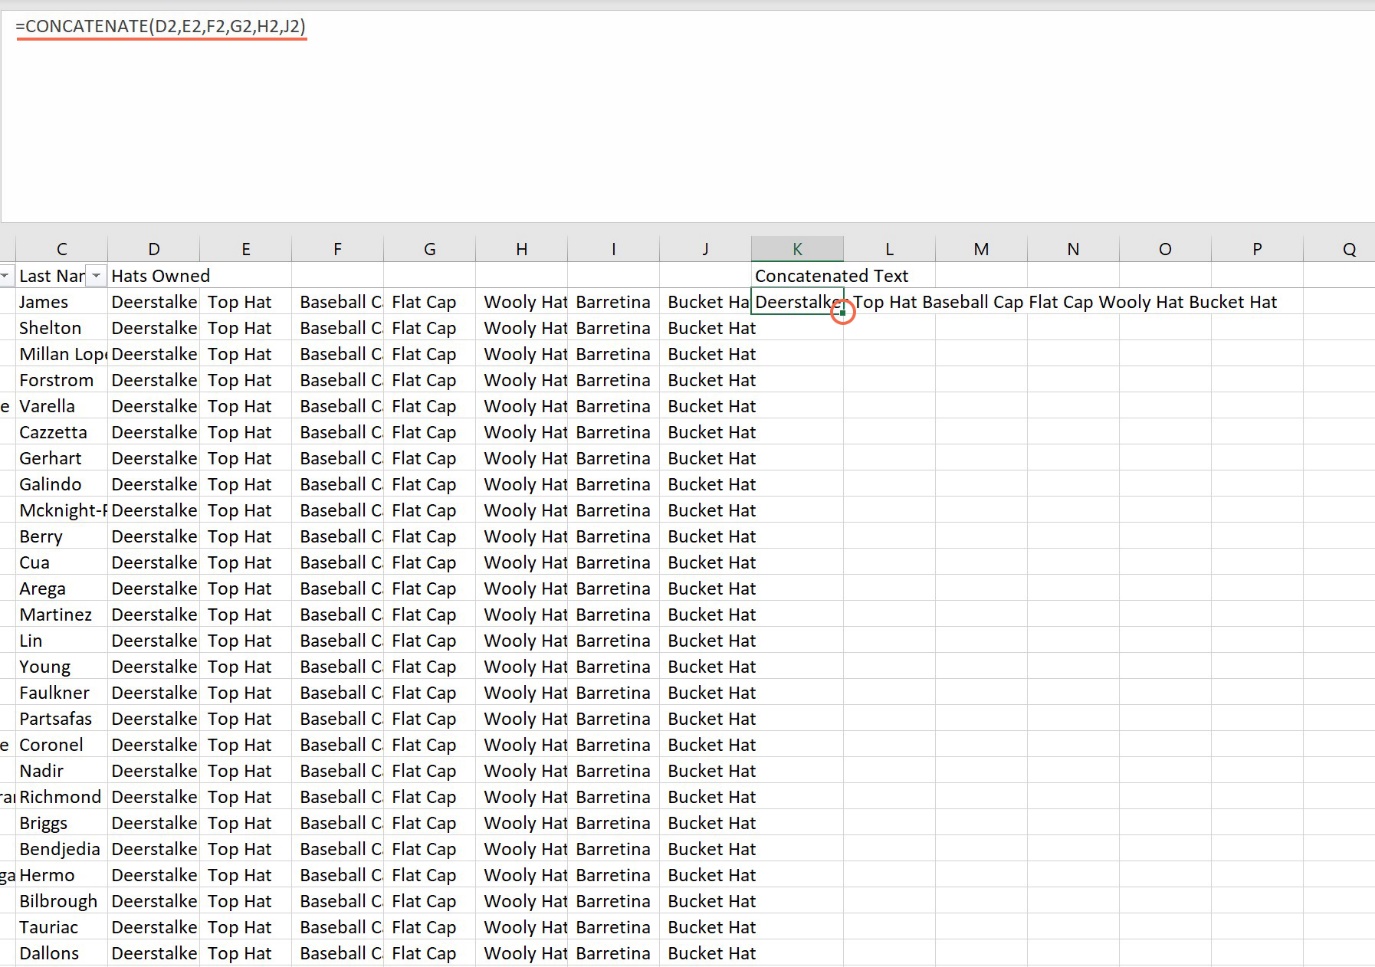
If you require the opposite – as in, you are looking to combine various cells, you need the CONCATENATE function. It’s pretty simple – if you’d like to combine the a bunch of cells on one row, like D2 to J2, you use the formula =CONCATENATE(D2,E2,F2,G2,H2,I2,J2). With a large dataset, you can use the autofill handle to fill the entire column:
Final thoughts
Using one or any combination of these tips should help to ensure your dataset is properly prepared to dig into. There are plenty of other tips that may be of interest, from freezing the top row of your sheet, to the IFERROR function, but there’s plenty here to start.
Cleaning data is a vital skill. It’s useful in many work situations and is a fundamental part of any data analysis project. But there’s much more to it. To perform excellent data analysis, you must think like an analyst. You must understand the problem space and question you’re trying to answer, clean and process your data, and have the tools and techniques to analyse it, drawing out inferences and insights that aren’t visible in the raw data alone.
In our course – Analysing Data in Excel – we cover all the above and more. We’ve been training companies of all sizes and individuals since 2009, and we’ve condensed that experience into this short, impactful course.
We cover:
| Course syllabus | The course covers the fundamental skills, tools and functions to be competent at analysing data in Excel. Including:
|
Learning outcomes
- Produce a range of spreadsheets, including a cleaned data set, PivotTables, PivotCharts
- Apply Excel formulae – such as concatenate, trim, and proper – to data sets to clean and analyse data
- Calculate mathematical functions including averages, counts and sums
- Identify which Excel functions and formulae are appropriate to perform mathematical functions, clean and interpret data, and answer business questions
- Improve decision making, thinking efficiency and problem-solving in Excel
- Apply numerical and visual formatting, including conditional formatting, slicers and timelines, to spreadsheets to produce clean and comprehensible workbooks
- Improve spreadsheet efficiency and maintenance with shortcuts, navigation commands, and design principles