
Reshaping data sets
Python has operations for rearranging tabular data, known as reshaping or pivoting operations.
For example, hierarchical indexing provides a consistent way to rearrange data in a DataFrame.
There are two primary functions in hierarchical indexing:
- stack(): rotates or pivots data from columns to rows
- unstack(): pivots data from rows to columns
Here is the syntax for both the functions:
DataFrame.stack(level=- 1, dropna=True)
DataFrame.unstack(level=- 1, fill_value=None)
Let’s try these operations with some examples. Use these code snippets:
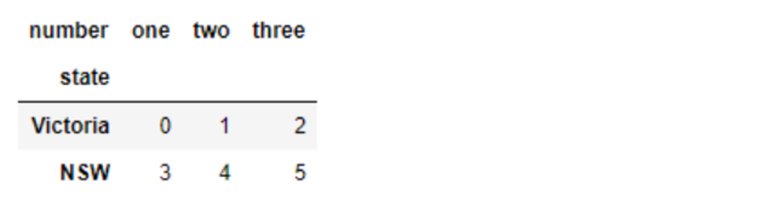
First, create a dummy DataFrame.
Code:
data = pd.DataFrame(np.arange(6).reshape((2,3)),
 index=pd.Index(['Victoria', 'NSW'], name='state'),
 columns=pd.Index(['one','two','three'], name='number'))
data
Output:
Next, we use the stack() function, we will pivot the columns into rows
Code:
data_stack = data.stack()
data_stack
Output:
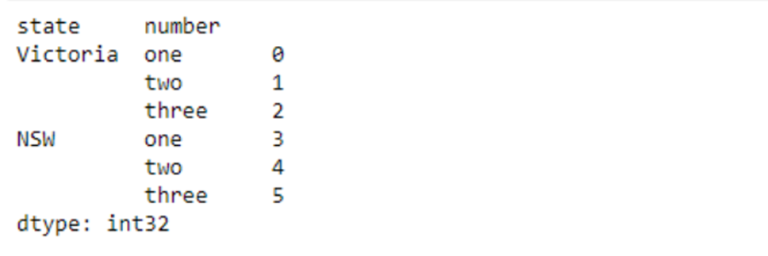
You can see that:
-
the operation converted the columns to row labels
-
the values now have hierarchical indexing (state and number)
-
the operation converted the DataFrame to a series.
You can confirm these changes with this code:
type(data_stack)
Output:
pandas.core.series.Series
data_stack.index
Output:
MultiIndex(levels=[['Victoria', 'NSW'], ['one', 'two', 'three']],
 labels=[[0, 0, 0, 1, 1, 1], [0, 1, 2, 0, 1, 2]],
 names=['state', 'number'])
From a hierarchically indexed series, you can rearrange the data back into a DataFrame with the unstack() function.
Try this code:
data = data_stack.unstack()
data
Output:
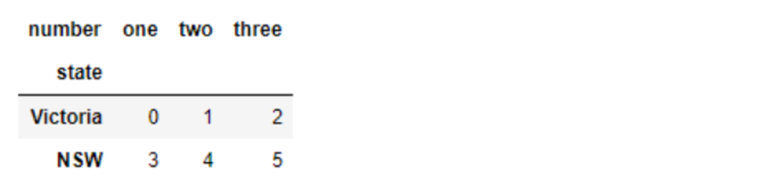
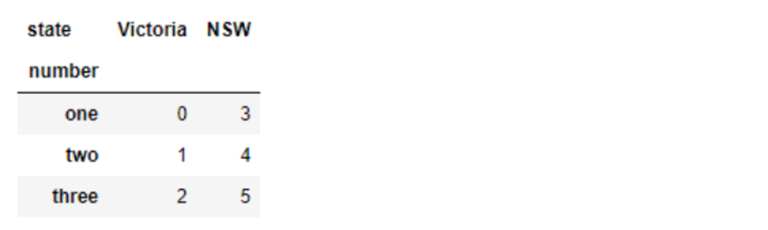
By default, the innermost level is unstacked. In our example, it was a number. However, you can unstack a different level by passing a level number or name as a parameter to the unstack method.
For example, try this code that unstacks data_stack at the level of state, rather than number:
Code:
data_state = data_stack.unstack('state')
data_state
Output:
Data Wrangling and Ingestion using Python


Reach your personal and professional goals
Unlock access to hundreds of expert online courses and degrees from top universities and educators to gain accredited qualifications and professional CV-building certificates.
Join over 18 million learners to launch, switch or build upon your career, all at your own pace, across a wide range of topic areas.


