
Data manipulation and transformations
We learned joining, merging, and rearranging data, but data analytics often requires many other manipulation operations.
For example:
-
bulk transforming records (eg, add missing address information)
-
detecting and filtering outliers
-
removing duplicates from a dataset.
Now you will explore how Pandas assists with these kinds of tasks. Let’s look at how you would use Python for each of these examples.
Transforming data using a function or mapping
For many data sets, you may need to perform some transformations based on values in Pandas Object.
Consider this hypothetical scenario:
You have a DataFrame consisting of customer names and addresses. The addresses include code and city, but country information is missing. You need to add the country information to this dataframe. Fortunately, you have city-to-country mapping maintained in a dictionary. You want to create an additional column in the dataframe that contains the country values.
Let’s implement this solution using the map method in this particular case. This method is called on a series and you pass a function to it as an argument. The function is applied to each value in the series specified in the map method.
Use these code snippets for a demonstration:
Code:
df_person = pd.DataFrame([
	['Person 1', 'Melbourne', '3024'],
	['Person 2', 'Sydney', '3003'],
	['Person 3', 'Delhi', '100001'],
	['Person 4', 'Kolkata', '700007'],
	['Person 5', 'London', 'QA3023']
], columns=['Name','City','Pin'])
df_person
Output:

Next, let us create a dictionary for the city and the country.
Code:
dict_mapping = {
	"Melbourne":"Australia",
	"Sydney":"Australia",
	"Delhi":"India",
	"Kolkata":"India",
	"London":"United Kingdom"
}
dict_mapping
Output:
<img src="https://ugc.futurelearn.com/uploads/assets/91/d7/91d731d7-389d-4e6d-8d16-b5392eae5967.png" alt=""Screenshot of text that reads:
{‘Melbourne’: ‘Australia’, ‘Sydney’: ‘Australia’, ‘Delhi’: ‘India’, ‘Kolkata’: ‘India’, ‘London’: ‘United Kingdom’}"”>
Click to enlarge
Code:
df_person['Country']= df_person['City'].map(lambda x: dict_mapping[x])
df_person
Output:

As we can observe in the result:
-
the map method is called on the series df_person[‘City’]
-
there is an inline function using lambda notation (covered in Course 1)
- this inline function takes key(x) as an input, and returns the value corresponding to
-
this key(x) from the dictionary object dict_mapping
- the resulting value is stored in a new column, ‘Country’, in the original DataFrame df_person.
Detecting and filtering outliers
You learnt about the technique for filtering outliers in Course 2, which discussed boolean indexing. Remember, you can create boolean filters using conditions (eg, data < 3) and then use that boolean filter with indexing on a dataframe and series to extract a subset of data values. Through filtering, you can remove outlier data points from a dataframe or series.
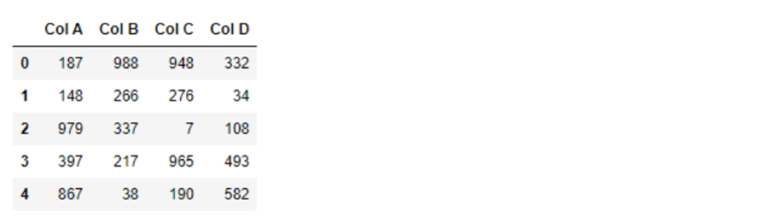
As an example, let’s create a dataframe with random numbers. You will extract particular rows based on a filter applied to values in a particular column.
Use these code snippets for a demonstration to create a random dataframe:
Code:
data = pd.DataFrame(np.random.randint(5, 1000, size=(1000,4)), columns = ['Col A', 'Col B', 'Col C','Col D'])
data.head()
Output:
Then, describe the dataframe, statistical summary of the dataframe.
Code:
data.describe()
Output:
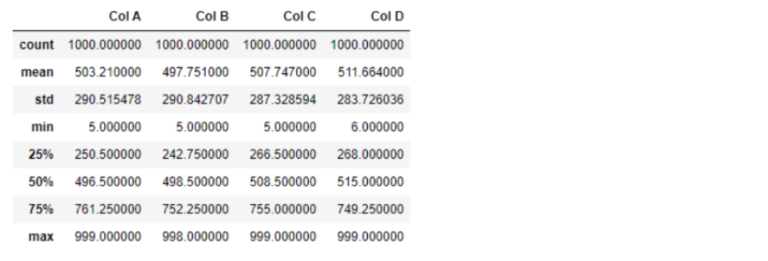
Take a look at Col D, in the output above:
The minimum value is 6.
The maximum value is 999.
The mean is 511.664.
Let’s say you want to filter all the records where the value in Col D is less than 400. For this, create a boolean filter on Col D and then apply that filter to the dataframe as an index to get the subset of the data.
Try these code snippets in your Jupyter Notebook:
Code:
#Create a filter
boolean_filter = data['Col D'] < np.abs(400)
boolean_filter.head()
Output:
0 True
1 True
2 True
3 False
4 False
Name: Col D, dtype: bool
Code:
#Apply this filter on the DataFrame
data_filtered = data[boolean_filter]
data_filtered.describe()
Output:
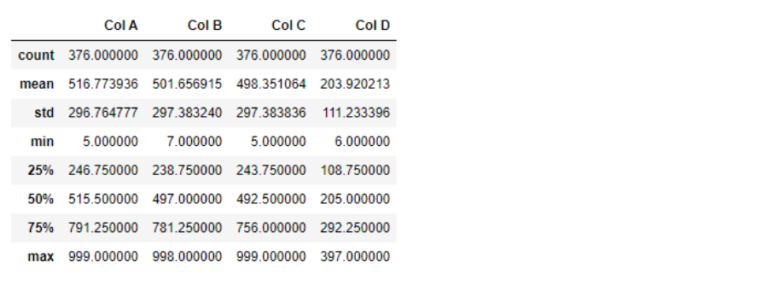
As you can see from the statistical summary of the filtered dataset, the maximum value in Col D is now 397, which is less than 400.
You can apply this filter inline as well, and to all the columns:
Code:
data_filtered_new = data[np.abs(data)<400]
data_filtered_new.describe()
Output:

Removing duplicates
There are many real-life situations where you would find duplicate records in a data set such as recurring salary details and email addresses of the same person within the same file or duplicates of addresses for two people of the same household (in some cases, you might need to drop one name and retain the other to avoid duplicate addresses).
Pandas has an easy-to-use function, drop_duplicates(), that removes duplicate records from a dataframe.
Let’s test this function through an example. First, you need to create a test dataframe with some duplicate records:
Code:
df1 = pd.DataFrame({'k1': ['A']*3 + ['B']*4,
 'k2': [1,1,2,2,3,3,4]
 })
df1
Output:

[Click to enlarge]
Now, use the function to drop the duplicates.
drop_duplicates() can work in two ways:
If you don’t specify a column, the function operates on all columns collectively (ie, drop rows with exactly the same values in all columns).
If you do specify a column, the function removes duplicates only from that column (ie, keep the first instance in another column).
Try this example without a specified column:
Code:
df_dedup = df1.drop_duplicates()
df_dedup
Output:

Next, try this example with a specified column:
Code:
#Remove Duplicate Values form Column k1
df_dedup_k1= df1.drop_duplicates('k1')
df_dedup_k1
Output:

Your turn
Can you add one more cell and run a similar code for removing the column k2?
Data Wrangling and Ingestion using Python


Reach your personal and professional goals
Unlock access to hundreds of expert online courses and degrees from top universities and educators to gain accredited qualifications and professional CV-building certificates.
Join over 18 million learners to launch, switch or build upon your career, all at your own pace, across a wide range of topic areas.


