Home
/ IT & Computer Science / Business Technology / Essential Mathematics for Data Analysis in Microsoft Excel / Why Not Pie Charts

Why Not Pie Charts
.
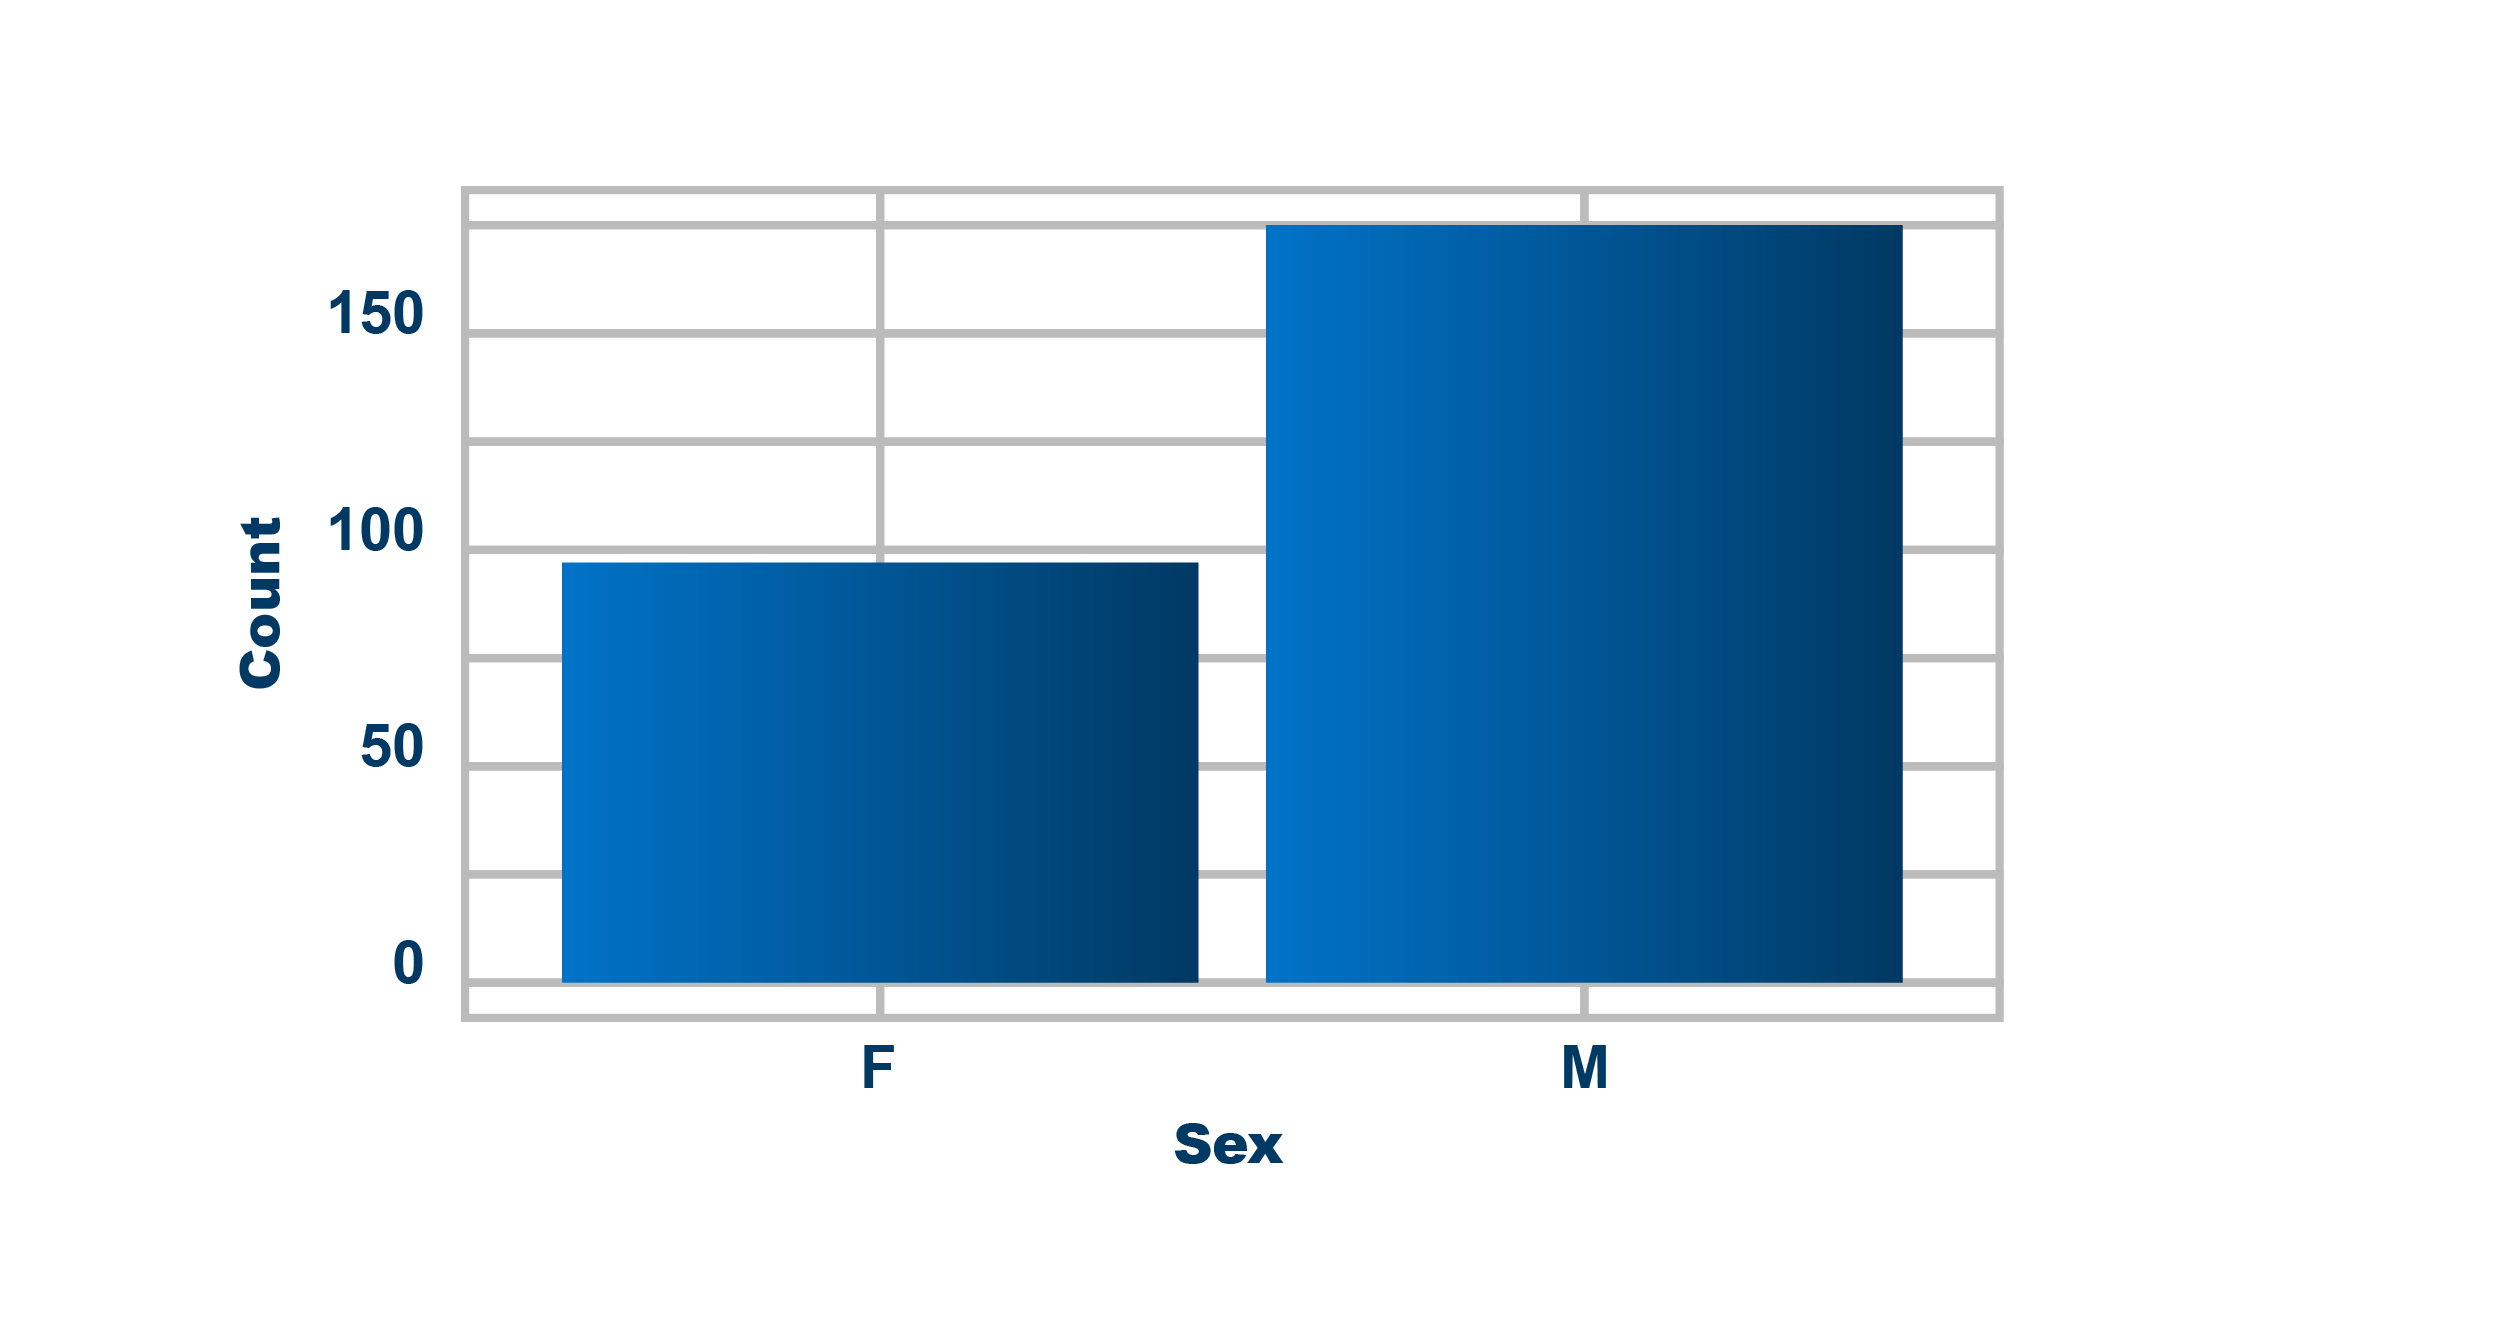
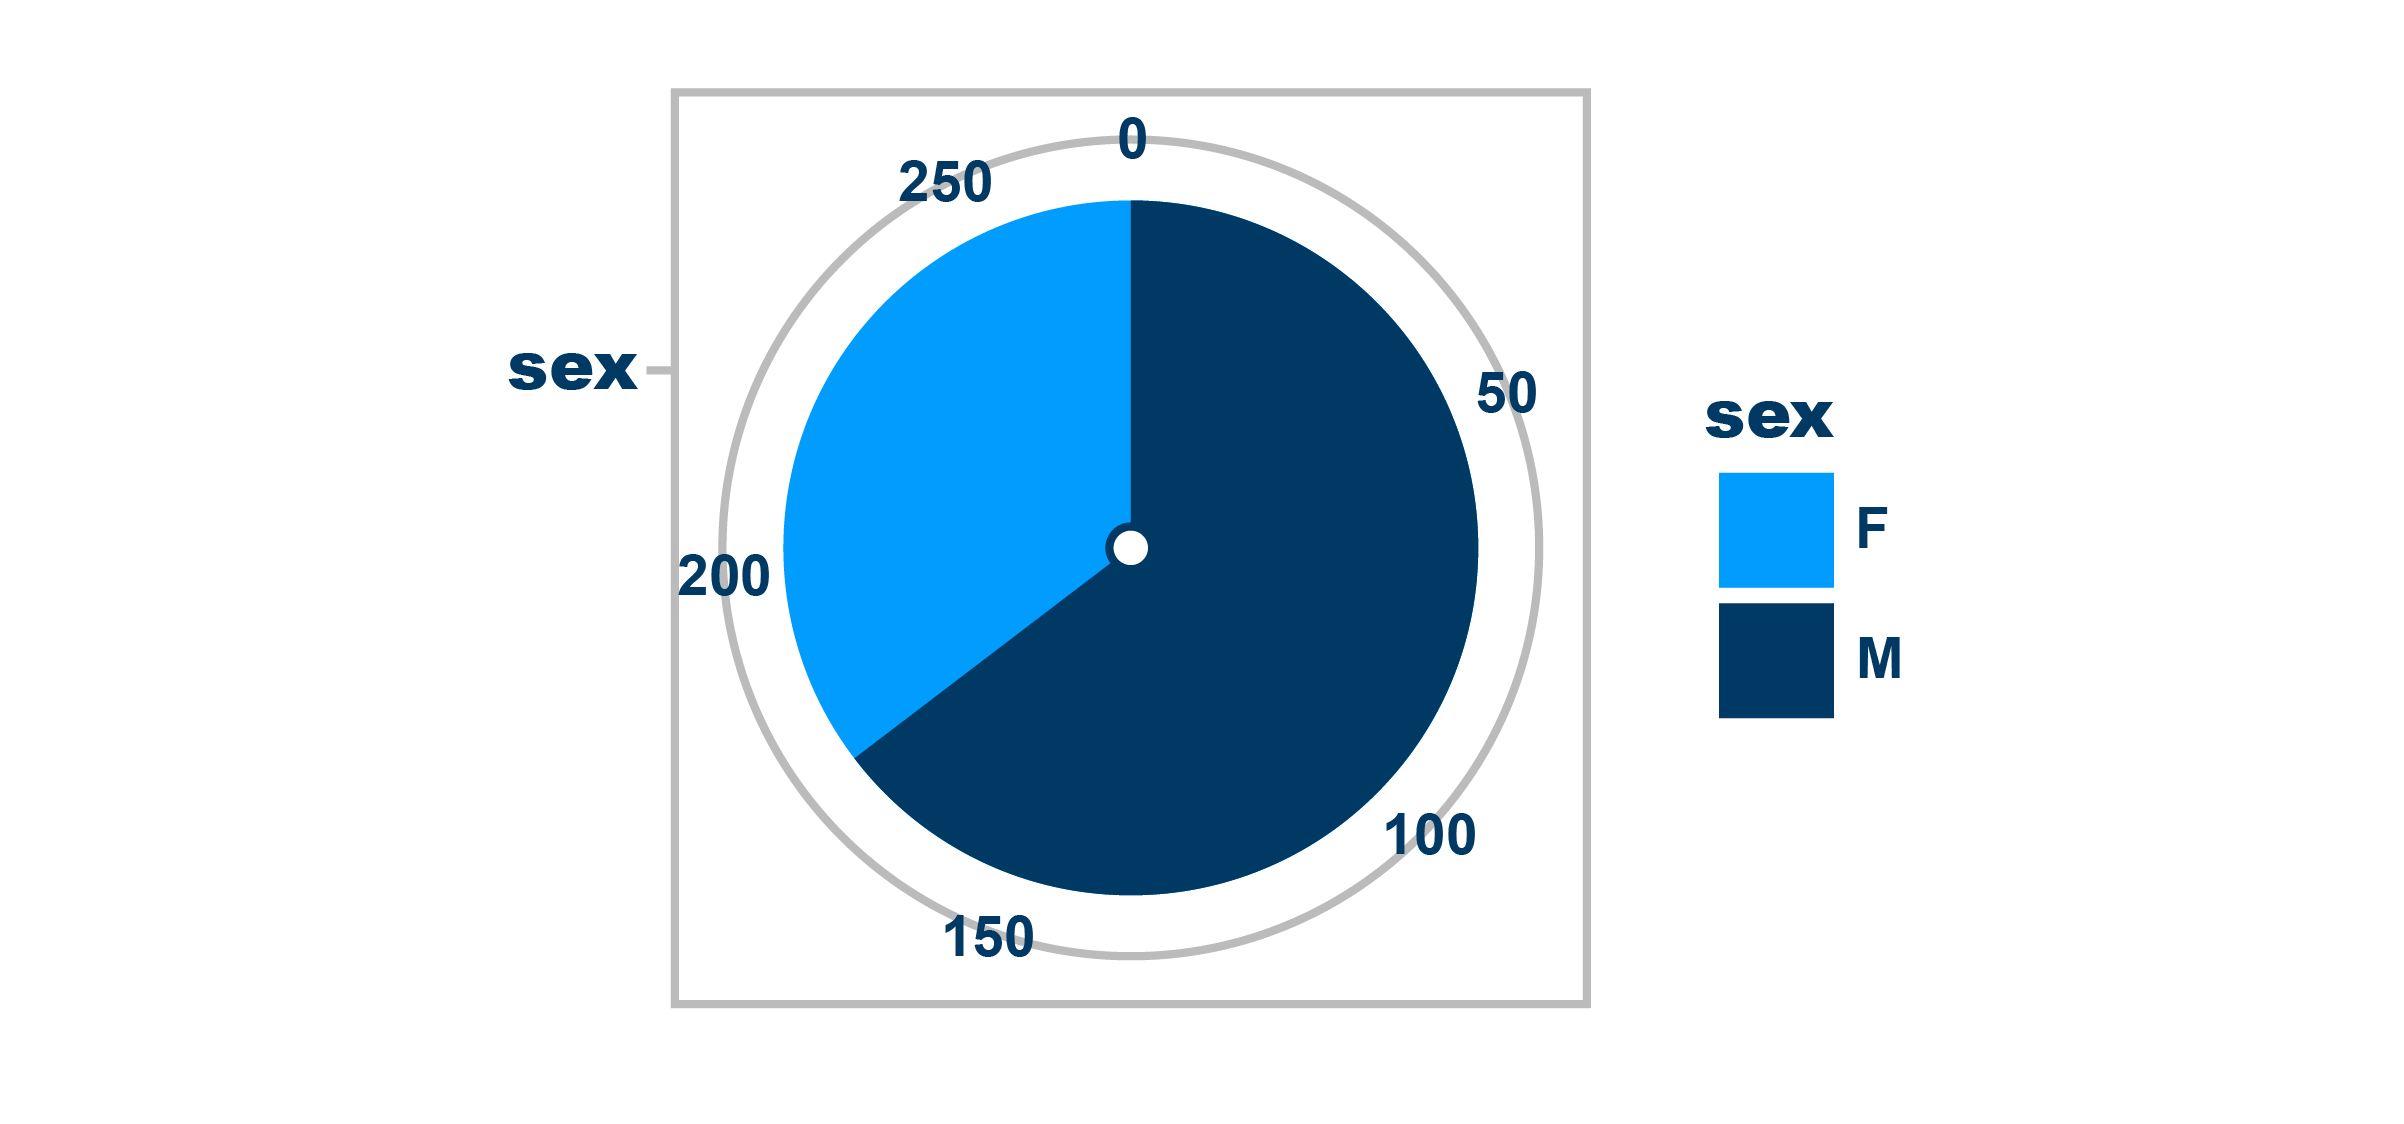
In the previous activity, we differentiated between histograms and bar graphs. Let’s have a look at why it is better to use a histogram or a bar graph, rather than using a pie chart.
Pie charts are visually appealing and they do have a place, but they make it hard to compare data effectively.
In a bar chart we can easily see:
- Counts of the data
- How the group sizes compare to each other
- More bars can be added easily if there is an extra category to be included
Pie charts only show:
- Relative sizes of groups, which makes it difficult to effectively compare
- Slices of data, especially when there are more categories, making the data more confusing to compare
Join the discussion
Can you find an example of when a pie chart has led to a misleading view of data?Use the discussion section below and let us know your thoughts. Try to respond to at least one other post and once you’re happy with your contribution, click the Mark as Complete button to check the Step off, then you can move to the next step.
This article is from the online course:
Essential Mathematics for Data Analysis in Microsoft Excel

Created by

This article is from the free online
Essential Mathematics for Data Analysis in Microsoft Excel