Mode
In this activity, we’ll look at the three M’s of data analysis: Mode, Mean and Median. They each measure the ‘centre’ of a data set in a slightly different way and the usefulness of each of these summary statistics depends on the type of data we’re dealing with.
The mode is simply the most common score.
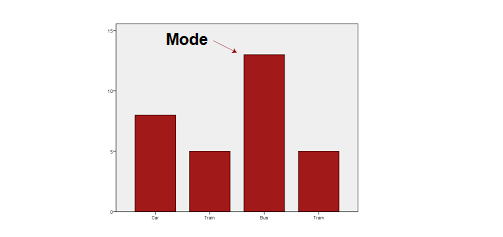
The mode is not very helpful with continuous variable because it can change easily and does not show us a valuable picture of what we’re trying to achieve in statistics.
In the image above, the most common data point is people aged 30, but we can see that the average age of people is probably higher than this.
Since the mode can shift around quite a bit as more data is added, we say that the mode has ‘low sampling ability’.
Normally, a mode will be useful for categorical data, such as males vs females.
Essential Mathematics for Data Analysis in Microsoft Excel


Essential Mathematics for Data Analysis in Microsoft Excel