Mean Pros and Cons
Now that you understand the mean, let’s have a look at when you would use the mean and when you should avoid it.
In most instances, the mean gives us a more accurate centre point of the data because it takes into account every instance of a variable. It normally gives us a good view of the average.
Take a look at this image that shows the mean point of all the collected data:
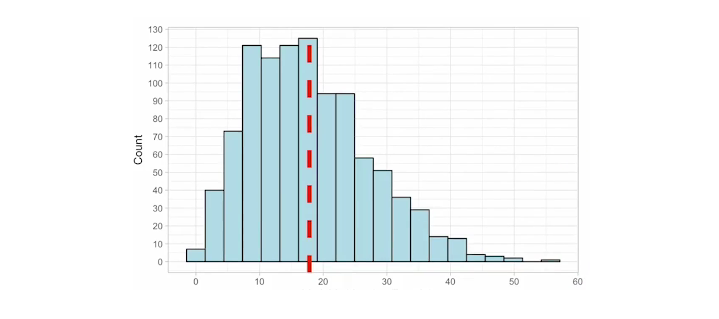
However, sometimes we have outlying data that could skew our mean calculation. This could be a little problematic for showing an accurate centre point, so we might want to then consider using the mode or median calculation to get a better view.
When working with data, you will need to use your discretion to try and find the most accurate representation of what you are trying to show.
Essential Mathematics for Data Analysis in Microsoft Excel


Essential Mathematics for Data Analysis in Microsoft Excel