Crosstabs
Crosstabs are a useful way to look at relationships among categorical (nominal or ordinal) variables.
Cross tabs are basically a table of data where there are two categories that need to be fulfilled in order to get the data we are looking for. One category will be in the rows and the other category will be in the columns.
For example, we may want to know how many people want decaf coffee or normal coffee and how many of each of those would like sugar in their coffee or not:
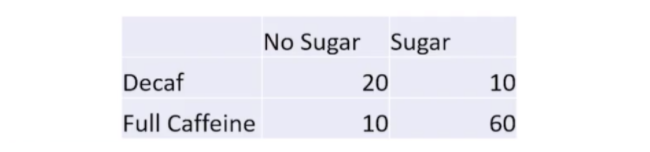
From this table, we can draw some conclusions such as one-third of decaf coffee drinkers like their coffee to have sugar in it.
Crosstabs allow us to tell stories about our data because they allow us to use multiple categories.
Join the discussion
How do you think crosstabs enhance our experience of the data that we are trying to work with?Use the discussion section below and let us know your thoughts. Try to respond to at least one other post and once you’re happy with your contribution, click the Mark as Complete button to check the Step off, then you can move to the next step.
Essential Mathematics for Data Analysis in Microsoft Excel


Essential Mathematics for Data Analysis in Microsoft Excel