
Downstream analyses
We finally reached step 4 – downstream analysis!
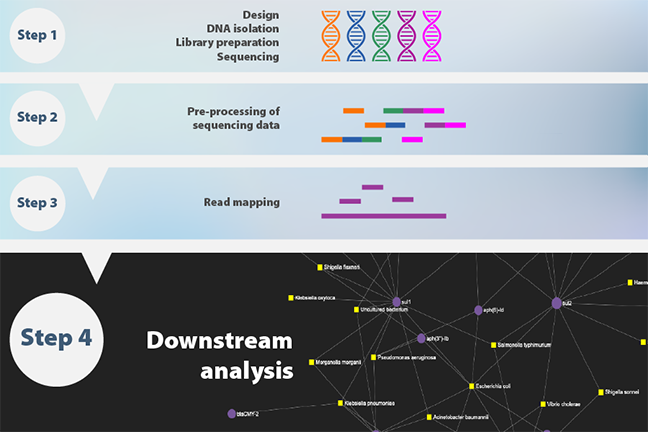
This is the step in which we try to make sense and interpret the data obtained. And this is precisely why ResistoXplorer was developed: to facilitate the visual exploration and analysis of resistome data by researchers not often performing the upstream analysis themselves. We invite you to join us in the exciting week 3 of our course, where we will learn the concepts behind ResistoXplorer and how to use the web-based tool!
Exploring the Landscape of Antibiotic Resistance in Microbiomes


Exploring the Landscape of Antibiotic Resistance in Microbiomes
Reach your personal and professional goals
Unlock access to hundreds of expert online courses and degrees from top universities and educators to gain accredited qualifications and professional CV-building certificates.
Join over 18 million learners to launch, switch or build upon your career, all at your own pace, across a wide range of topic areas.


