
Everything You Need to Know About Data Visualisation
What is data visualisation?
In the simplest form, data visualisation is the graphical presentation of data and insights. At its best, data visualisation is an art.
Now, let’s pull some threads together.
- Simplify: Good data visualisation captures the essence of data without oversimplifying it.
- Compare: You should be able to compare data visualisations side by side.
- Attend: Data visualisations should enable you to separate relevant information from irrelevant information easily.
- Explore: Data visualisation tools should enable you to explore data and discover things. It should not be limited to answering a specific question.
- Diversify: Different views of the same data can result in different insights.
Why use data visualisation?
Data should not be used merely to ask ‘what’. It should be used to ask ‘why’. Why is a particular trend taking place? Why is sales growth declining?
Data visualisations can be used for different purposes. Within your professional life, you will have come across different charts, graphs and other data visualisations that served one or more of the below-mentioned purposes.
- Answer questions or discover them
- Make decisions
- See data in context
- Expand memory
- Support graphical calculations
- Spot patterns
- Tell a data story
- Inspire
Key design principles for effective data visualisations
While there are some principles that play a more important role, depending on the tool and purpose of the data visualisation you intend to generate, we have identified a few principles that are common across the board.
Balance the design
Visual elements such as colour, shape, and texture should be equally distributed across the whitespace.
There are three types of balances in design.
- Symmetrical – Each side of the visual is the same as the other.
- Asymmetrical – Both sides are different but still have a similar visual weight.
- Radial – Elements are placed around a central object which acts as an anchor.
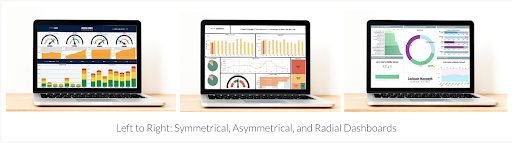
Source: iDashboards
Emphasise the key areas
User’s attention should be drawn to the correct data points by carefully choosing the size, colours, and contrast as the goal is to ensure that important data doesn’t go unnoticed.
Illustrate movement
Movement directs users’ attention in a certain direction. The visual elements should mimic movement in an F pattern. Starting from top left to right, you should then move down the page. (This principle applies to static visualisations, too.) If the visualisation tool you are using is capable of animation and interactive designs, then the movement principle should already be covered.
Smart use of patterns
Patterns help to spot anomalies. A disruption of a pattern draws the attention of the users to that anomaly.
Proportions
In data visualisation, the proportion is made up of the size of each element. It helps to indicate the weight of different data sets and the relationship between their values. If you wish to emphasize a particular data point, then you can make it larger in proportion compared to others.
Variety
Variety in data visualisations would keep your users interested and curious. By avoiding repetition, you can engage your target audience and drive key messages.
Theme
A unified theme ensures that your design remains consistent and follows a standard.
Now that you are aware of the different principles governing data visualisation, we will look at how data visualisation is used in real life.
Use cases and examples
Let’s look at different forms of visualisations.
Conceptual diagrams
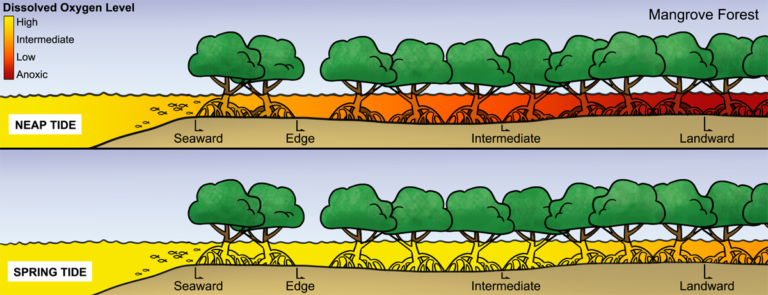
Source: Estuarine, Coastal and Shelf Science, 2017. [3]
Infographics
Charts
Tables
Design considerations for common charts
Let’s look at some examples of good and bad visualisations.
Example 1: Bar charts & axes
Choose the right weight of the bars when you show the data on a bar chart to avoid gaps between the bars. Don’t begin the axis with a value more than zero, as that causes the bars to shrink and might appear to skew your data.
Example 2: Line charts
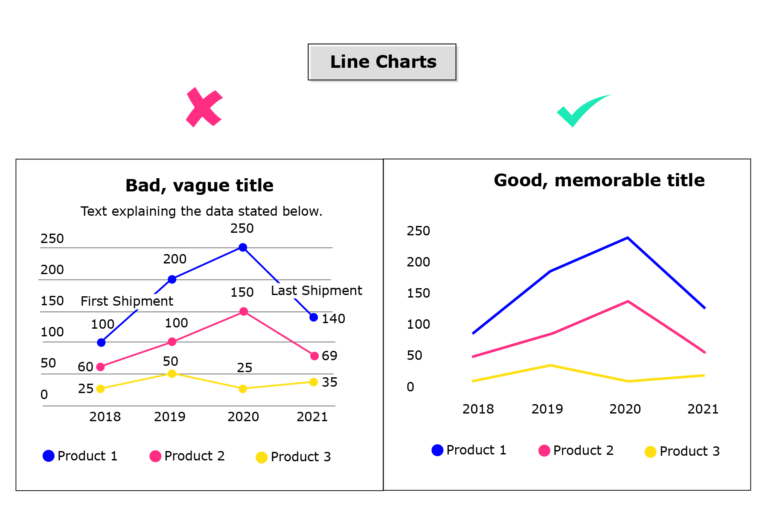
You are not required to mention all the information and data points in your chart to such an extent it becomes too busy and difficult to read. Legends aren’t compulsory for single line charts. However, they can be useful for multiple lines on the same charts.
Example 3: Pie charts
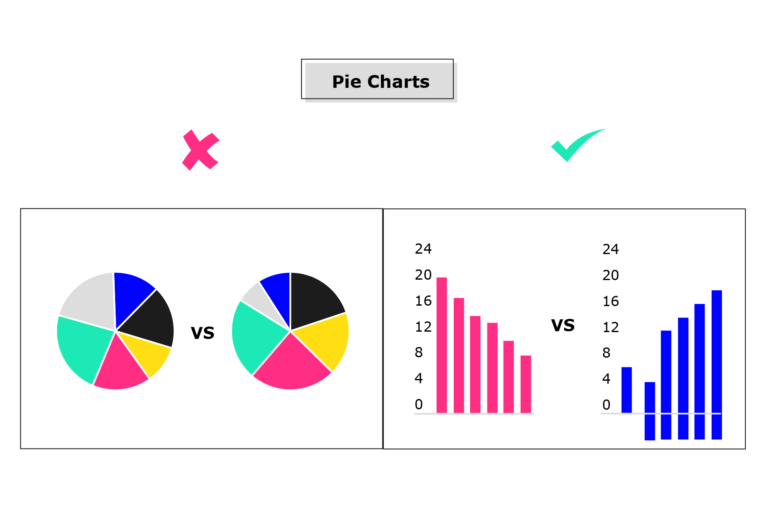
Never ask your viewer to compare two pie charts. A bar chart would be better to compare differences in length and volume.
Example 4: Pictorial charts
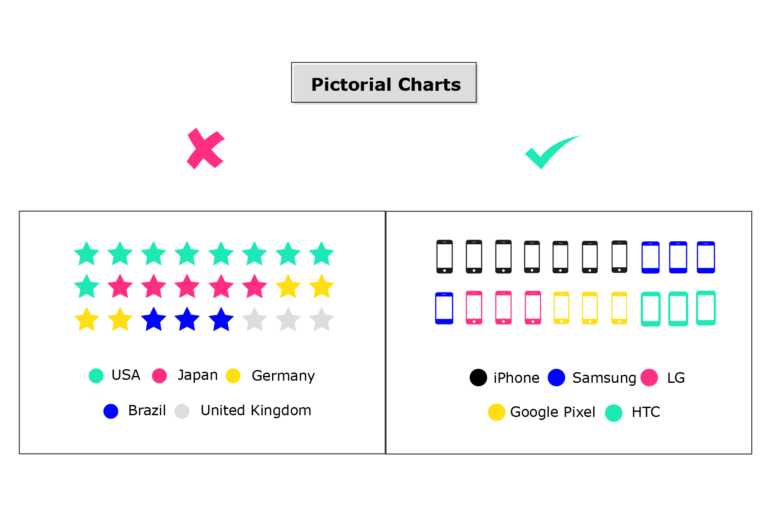
Choosing the right icon is key to the perfect pictorial chart. You should not pick a pictorial icon that does not suit the story or the type of data. Pictures and icons should attract users’ attention. Also, consider the device your users would be using to view your charts. How would your pictorial charts appear on a mobile phone? Users should be able to easily read the charts no matter the device they use.
Example 5: Funnel charts
![Example of a correct and incorrect funnel chart]. The incorrect version has no labels and extra white space. ZThe correct version has labels to provide clarity.(https://ugc.futurelearn.com/uploads/assets/a7/3c/a73c60b8-9c76-4489-8d74-c8c6e9800ea8.png)
You should use the correct colour schemes. Colours can make or break your funnel chart and make it almost impossible to read it. Avoid using colour schemes that are too dark or too bright, which makes it too hard to read the chart. Try different shades of colours that are easy to the eye. Dark to light colour schemes to provide connectivity and flow.
References:
-
The Art of Data Visualization Off Book PBS Digital Studios. PBSoffbook; 2013 May 9. Available from: https://www.youtube.com/watch?v=AdSZJzb-aX8&feature=youtu.be - Why Does Visualizing Data Matter? Tableau Software; 2012 Mar 29. Available from: https://www.youtube.com/watch?v=Gzv4bsG9gd8
- Mattone C & Sheaves M. Patterns, drivers and implications of dissolved oxygen dynamics in tropical mangrove forests. Science Direct. 2017 Oct 15; 197:205-213
Financial Analysis for Business Performance: Reporting and Stakeholder Management


Financial Analysis for Business Performance: Reporting and Stakeholder Management
Reach your personal and professional goals
Unlock access to hundreds of expert online courses and degrees from top universities and educators to gain accredited qualifications and professional CV-building certificates.
Join over 18 million learners to launch, switch or build upon your career, all at your own pace, across a wide range of topic areas.


