Geostrophic balance: reading currents from sea level
In the last lecture you met the forces that move the ocean. Now we watch two of them settle into a balance – and that balance turns out to govern most of the large-scale currents in the sea. It is called geostrophic balance, and understanding it lets you do something remarkable: read a map of sea level as a map of the currents beneath.
A slope in the sea
Start with a simple picture. Imagine the sea surface is slightly higher in one place than another – a gentle slope, perhaps only a few centimetres over many kilometres. Because pressure at any depth is the weight of the water above, that extra height means slightly higher pressure under the high side. The result is a pressure gradient force, pushing water from the high side toward the low – from high pressure to low.
If that were the whole story, the water would simply flow downhill and the slope would flatten out. But the ocean is on a rotating planet, and that changes everything.
Turned into balance
Follow a parcel of water as the pressure force starts to push it “downhill.” As soon as it moves, the Coriolis force begins to act, deflecting it to the right (in the northern hemisphere). The parcel’s path curves. It keeps curving as it speeds up, until it reaches a state where the Coriolis force exactly opposes the pressure gradient force – the two are equal and opposite, and the parcel stops turning.
At that point the forces are in geostrophic balance, and the parcel is no longer moving downhill at all. It is moving along the slope, at right angles to the direction it was first pushed.
This gives a simple, powerful rule:
Near the surface, the geostrophic current flows along the sea-level slope – to the right of the downhill direction in the northern hemisphere, and to the left in the southern hemisphere.
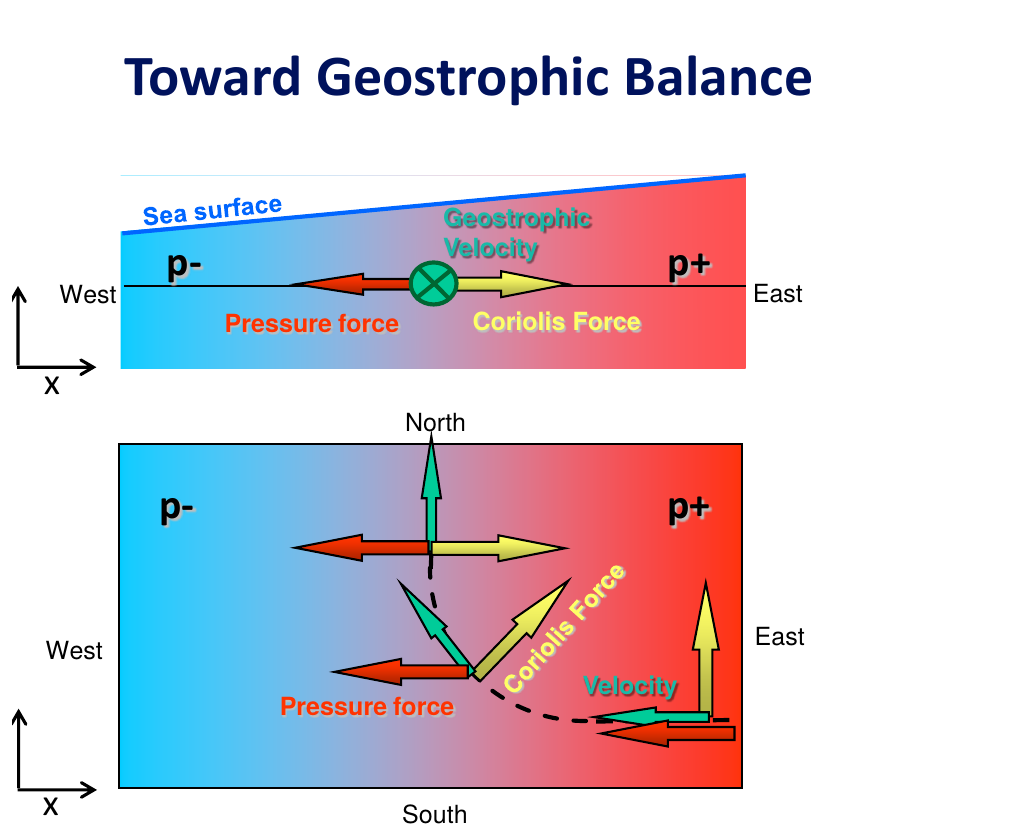 Figure 1: A parcel pushed by the pressure gradient force is deflected by the Coriolis force until the two balance, leaving a current that flows along the sea-level slope.
Flow around highs and lows
Apply that rule around a broad bump in the sea surface – a sea-level high. The pressure force points outward, away from the high, in every direction. The balancing Coriolis force must point inward. In the northern hemisphere, that arrangement means the current circles the high clockwise. Around a dip – a sea-level low – the current circles the other way, anticlockwise.
In the southern hemisphere, both directions reverse. This is exactly the same logic that makes winds circle highs and lows in the atmosphere – another reminder that the ocean and atmosphere share their dynamics.
Sea level is a map of currents
Here is the payoff. If the direction and strength of the surface current depend only on the slope of the sea surface, then a map of sea level is, in effect, a map of the currents. Such a map is called dynamic topography.
Since the 1990s, satellites carrying radar altimeters have measured the height of the sea surface precisely enough to capture this. The variations are small – the total range of dynamic topography across the globe is only about three metres – yet from them we can read the great features of ocean circulation:
- The subtropical gyres, centred around 30° north and south, appear as broad sea-level highs with clockwise circulation in the north and anticlockwise in the south
- Their western edges carry the strongest currents, such as the Gulf Stream in the North Atlantic
- In the Southern Ocean, the sea surface slopes steeply downward toward Antarctica, marking the path of the Antarctic Circumpolar Current – the strongest and largest current on Earth
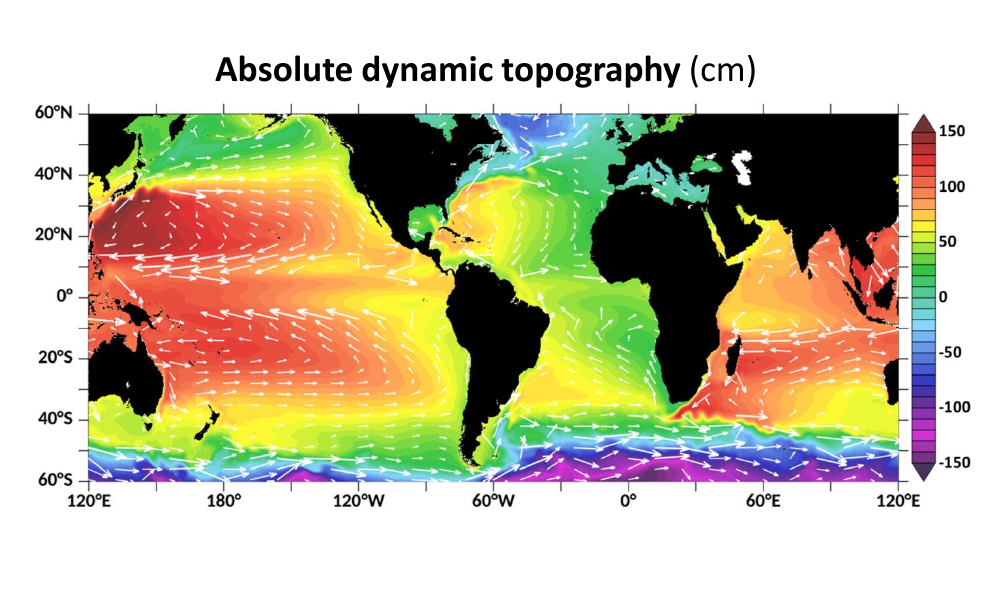
Figure 2: A map of absolute dynamic topography (sea level) read as surface currents – subtropical gyres, western boundary currents like the Gulf Stream, and the Antarctic Circumpolar Current.
One striking detail: a strong surface current of one metre per second corresponds to a sea-surface slope of just one centimetre per kilometre – so gentle it is hard to imagine measuring it, yet satellites do.
What happens at depth
Geostrophic currents are not only a surface phenomenon – they exist all the way down. But at depth, a second influence enters: differences in density from one place to another.
Two cases are worth distinguishing:
- When density depends only on depth – the same everywhere horizontally – conditions are barotropic. Here the geostrophic current is the same at every depth: whatever the surface does, the whole column does.
- When density also varies horizontally – warmer water beside cooler, saltier beside fresher – conditions are baroclinic. Here the geostrophic current changes with depth.
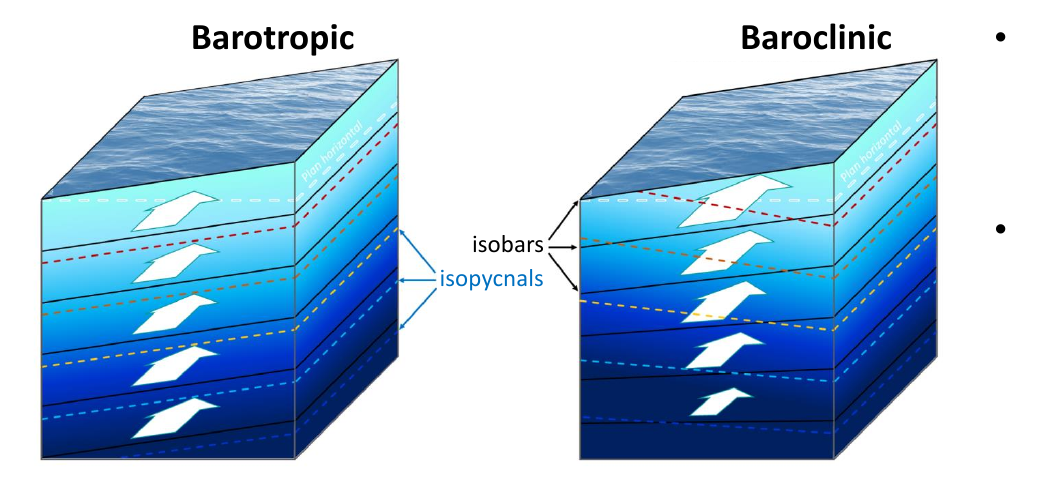 Figure 3: When density depends only on depth (barotropic), geostrophic currents are the same at all depths; when density also varies horizontally (baroclinic), they change with depth.
The link between the two is captured by an idea called the thermal wind: the more steeply the density surfaces tilt, the more the current changes with depth. In the Gulf Stream, for instance, the current weakens from about 1.5 metres per second at the surface to less than half a metre per second at 1000 metres deep – a strongly baroclinic situation. Where density surfaces are flat, currents barely change with depth, closer to barotropic.
Why sea level rises and falls
Since geostrophic currents come partly from sea-level differences, it is worth asking what makes sea level vary in the first place. A key part of the answer is temperature and salinity.
Water expands slightly when warmed and contracts when cooled, so a warmer column of water stands taller than a cooler one of the same salinity – the same thermal expansion that makes a thermometer work. A saltier column, by contrast, sits slightly lower. The height a column gains or loses this way is called its steric height.
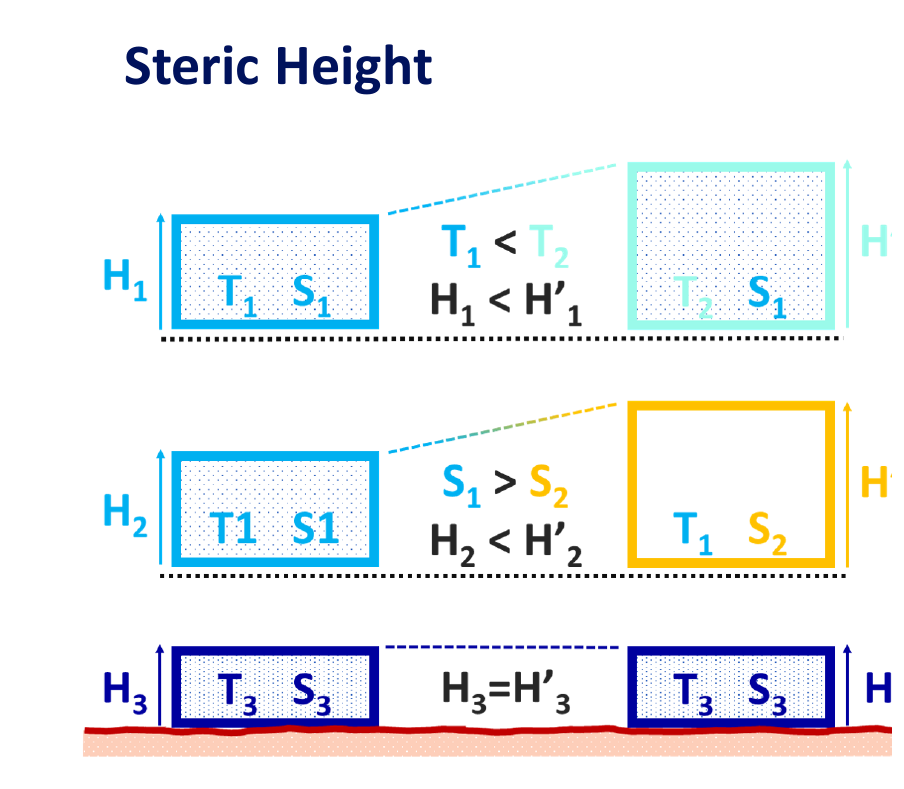 Figure 4: A warmer column of water stands higher (thermal expansion) and a saltier one sits lower (haline contraction) – the steric height effect linking temperature, salinity, and sea level.
This has a neat consequence: sea level and the depth of the warm surface layer rise and fall together. Where the warm layer is deep, more of the column is warm, so thermal expansion lifts the surface higher. And in a warming climate, the thermal expansion of seawater accounts for roughly half of global sea-level rise, with melting land ice making up much of the rest.
Key takeaways
- Geostrophic balance is the standoff between the pressure gradient force and the Coriolis force – the dominant balance across most of the ocean
- The resulting current flows along the sea-level slope, to the right of downhill in the north and left in the south, circling highs clockwise (north) and lows anticlockwise