Validation and Quality Control in Ocean Forecasting
The previous lectures showed how observations, through assimilation, improve a forecast. This final lecture of the module, again with Babette Tchonang, asks the question that closes the loop: once a forecast is produced, how do we know whether it’s any good? The answer is validation – and the quality control that makes it possible.
The lecture covers:
- Why validation matters – no forecast is perfect, because uncertainties exist in the observations, the atmospheric forcing, the model, and the initial conditions. Validation compares forecasts with real observations to quantify how good they are, identify strengths and weaknesses, and build user confidence in forecast products
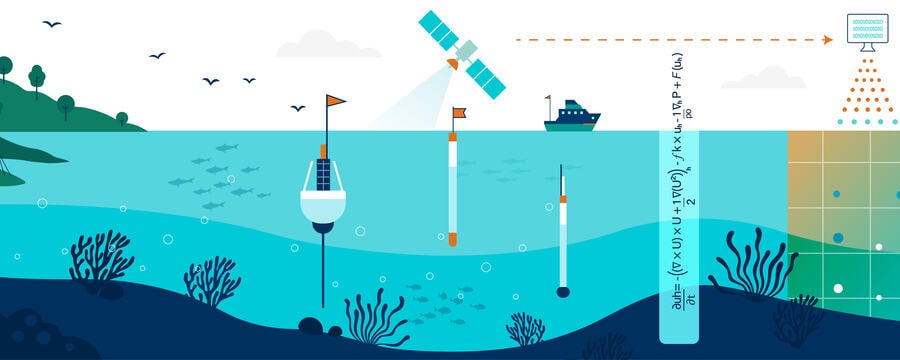
- What validation is – the process of evaluating forecast performance by comparing model predictions (temperature, sea level, currents, salinity, waves) with observations from satellites, Argo floats, buoys, tide gauges, and ships. It’s a continuous process, not a one-off check
- Why quality control comes first – before observations can validate a forecast (or be assimilated), they must be checked. Automated tests flag unrealistic values, spikes, and errors, assigning each measurement a quality flag; typically only the “good” and “probably good” observations are kept. Reliable validation depends on reliable observations
- The four classes of validation – the framework used by the OceanPredict community: Class 1 (large-scale 2D maps of SST, sea level, currents), Class 2 (1D time series at specific locations, like virtual moorings), Class 3 (integrated quantities such as ocean heat content and transports), and Class 4 (forecast skill assessment against observations and references). No single class is enough – together they give a complete picture
- The common metrics – the statistical measures (such as bias, RMSE, and correlation) used to quantify forecast performance, and how centres monitor forecast skill continuously to improve their systems over time
The message that closes the module: a forecast is only useful if we know how much to trust it. Validation is what turns a plausible-looking map into a product people can rely on – and quality control is what keeps the whole chain, from observation to forecast, honest. With this, you’ve followed the complete journey: from observing the ocean, through assimilating those observations, to validating the forecasts they produce.