Validation and quality control: knowing how much to trust a forecast
The last few lectures showed how observations, through assimilation, improve a forecast. This reading closes the loop with the question that every forecast must eventually answer: once it’s produced, how good is it? Answering that is the job of validation – and of the quality control that makes validation possible. As always, the aim here is the concept, not the mathematics.
Why validation matters
Look at a forecast map of sea surface temperature and it seems authoritative – smooth, detailed, full of information. But a plausible-looking forecast is not necessarily an accurate one, and no forecast is perfect. Uncertainty enters from four directions at once: the observations, the atmospheric forcing, the numerical model itself, and the initial conditions the forecast starts from.
Validation is how we deal with that. By comparing forecasts against real observations, it lets us:
- quantify how accurate a forecast actually is, rather than trusting its appearance
- identify where a system performs well and where it needs improvement
- build user confidence – so that people relying on the forecast for navigation, fisheries, or hazard warning know how much weight it can bear
That last point matters as much as the first. A forecast product is only useful if its users understand its reliability. Validation is what turns a map into a trustworthy tool.
What validation actually is
Forecast validation is the process of evaluating forecast performance by comparing model predictions with observations from the real ocean.
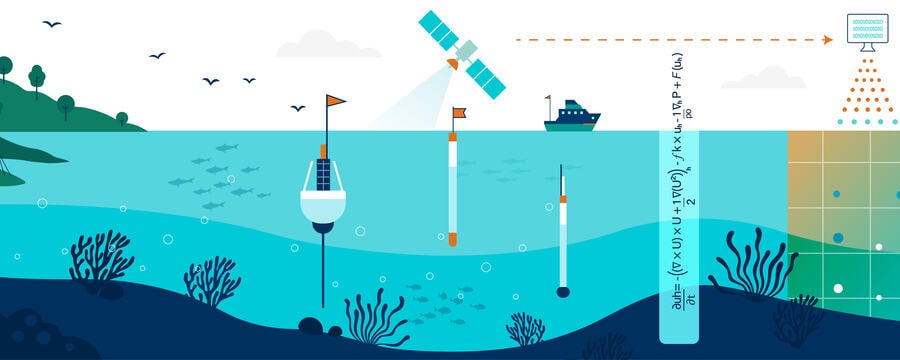
The model predicts ocean conditions – temperature, sea level, currents, salinity, waves. Those predictions are then compared with observations gathered by the very systems you met earlier in the week: satellites, Argo floats, drifting and moored buoys, tide gauges, and research vessels. The differences between forecast and observation are measured using validation metrics, which give an objective score of performance.
Crucially, validation is not a one-off check. It is a continuous process – operational centres validate their forecasts constantly, monitoring how skill changes over time and using what they learn to improve the system. Validation is less an exam the forecast sits once than a health check it undergoes every day.
Why quality control comes first
There’s a catch, though: you can only validate a forecast against observations if those observations are themselves trustworthy. And raw observations are not always reliable – instruments drift, sensors fail, transmissions garble, and measurements can contain unrealistic values, abrupt jumps, or constant “stuck” segments that are not physically plausible.
So before any observation is used – for validation or for assimilation – it passes through quality control. Automated tests, backed by expert review where needed, examine each measurement and assign it a quality flag according to its reliability. Typically, only observations flagged “good” (flag 1) or “probably good” (flag 2) are kept; the rest are set aside.
This is the gate that protects everything downstream. Reliable validation depends on reliable observations – and the same quality control also improves the data feeding assimilation, so it makes the forecasts themselves better, not just their evaluation.
The four classes of validation
Forecasts aren’t validated in just one way. Different products and different questions call for different approaches. The OceanPredict community organises them into four complementary classes:
- Class 1 – large-scale, two-dimensional. Maps comparing forecast and observed fields – sea surface temperature, sea level, currents – across a region or whole basin. This shows where a forecast is good or poor in space.
- Class 2 – one-dimensional, at specific locations. Time series, sections, and “virtual moorings” that track forecast performance through time at individual sites – ideal for comparing against a tide gauge or a mooring.
- Class 3 – integrated quantities. Bulk measures that summarise the ocean over large scales, such as ocean heat content and ocean transports – useful for monitoring the big picture and long-term consistency.
- Class 4 – forecast skill assessment. Match-ups between forecast and observation, case studies, and comparisons against reference forecasts – assessing how the system performs in practical, real-world application.
No single class is sufficient on its own. A forecast might look excellent on a Class 1 map yet fail a Class 2 timing test at the one location that matters. Together, the four classes assess the consistency, representativeness, accuracy, performance, and robustness of a forecasting system from every useful angle.
The metrics that quantify performance
Within these classes, a handful of statistical metrics put numbers on forecast quality. The three most common:
- Bias – whether the forecast systematically runs too high or too low. A persistent bias is decisive for a warning threshold: a forecast that reads consistently low will issue its warnings late.
- RMSE (root-mean-square error) – the typical size of the error, which sets a sensible safety margin around a forecast.
- Correlation – whether the forecast captures the timing of the ocean’s rise and fall – whether the peaks and troughs happen when the forecast says they will.
These are reported together, never alone, because each can hide what the others reveal. A forecast can have near-zero bias yet poor correlation – on average correct, but with its peaks on the wrong day. For a flood warning, that combination could be dangerous. A single number can flatter a forecast; the small set tells the truth.
Closing the loop
With validation, the module’s journey is complete. You’ve followed the ocean information all the way round: we observe the sea with satellites and in-situ platforms, assimilate those observations to correct the model and start the forecast, and validate the forecast against independent observations to know how far to trust it – feeding what we learn back into better observing systems and better models. Observe, assimilate, validate, improve: that continuous loop is operational oceanography.
Key takeaways
- No forecast is perfect – uncertainty comes from observations, forcing, the model, and initial conditions – so validation quantifies how good a forecast really is and builds user confidence
- Validation compares forecasts with real observations and is a continuous process, not a one-off check
- Quality control comes first: observations are flagged for reliability, and typically only “good” and “probably good” data are used – protecting both validation and assimilation
- The OceanPredict framework uses four complementary validation classes (2D maps, 1D time series, integrated quantities, and skill assessment) – no single class is enough
- Metrics such as bias, RMSE, and correlation are reported together, because a single favourable number can conceal a disqualifying failure