Welcome to Week 5: where forecast data comes from
Welcome to Week 5.
In Week 4, you saw how observations are woven into a forecast through data assimilation. But this raises a practical question that any forecaster must answer before a model can even run: where does all that input data actually come from? Every forecast begins with a flow of data arriving from somewhere – and this week is about those upstream data sources: what they are, who provides them, and how you can access them yourself.
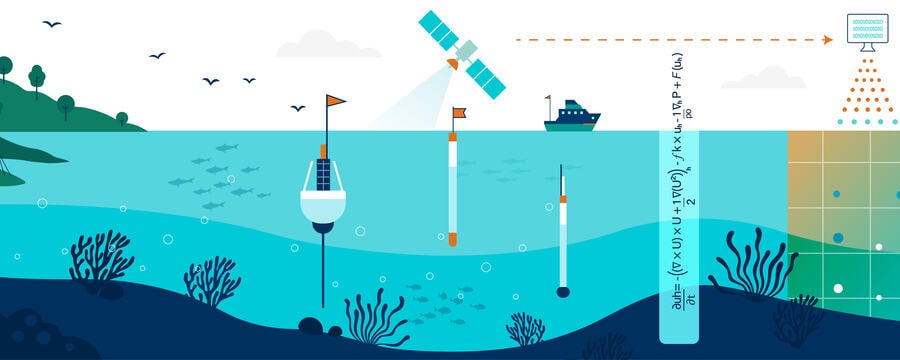
Numerical models don’t create their inputs from nothing. They need a constant supply of data to run: the state of the ocean to start from, the winds and heat fluxes that drive them, the shape of the seafloor, the rivers flowing into the sea, and the outputs of larger models at their boundaries. Knowing where these come from, how they’re prepared, and why their quality matters is what separates someone who merely reads a forecast from someone who understands what went into it.
Data-literate, not data engineers
A word about the aim of this week. The goal is to make you data-literate, not data engineers. You won’t be writing code or building data pipelines. Instead, you’ll learn to identify the key data providers, understand the role of atmospheric forcing, and confidently navigate the open-access platforms that put ocean and atmospheric data into everyone’s hands – for free.
That last point matters especially for regions where local data is scarce. Knowing which global, open-access products exist, and how to reach them, is often the difference between having usable forecast inputs and having none.
What you’ll explore
The week follows the data from its sources to your own hands:
- What upstream data sources are – and where they sit in the forecasting chain
- Global ocean data providers – the major international services that supply the world’s forecast data
- Copernicus Marine Service products – observations, reanalyses, and model inputs from one of the largest providers
- Atmospheric forcing – the winds, heat fluxes, and pressure data that drive ocean models, and the air-sea coupling behind them
- Regional and in-situ data – the national networks, moorings, and tide gauges that fill the gaps global products leave
- Accessing open-access data – how to navigate the ocean and atmospheric data portals yourself, in practice
By the end of this week
You should be able to:
- Identify the key upstream data sources used in ocean forecasting systems
- Explain the role of Copernicus Marine Service products in operational forecasting
- Understand the importance of atmospheric forcing datasets (winds, heat fluxes, pressure)
- Recognise the contribution of regional and in-situ observing networks
- Navigate and access free, open-access ocean and atmospheric data products
A word on how to approach the week: it’s easy to take a forecast’s inputs for granted, as if the data simply appears. In reality, every forecast rests on a global infrastructure of data providers, and knowing your way around it is a genuinely practical skill – one you can put to use the moment this week ends. Keep that in mind, and by Friday you’ll be able to find and download real ocean and atmospheric data yourself.