Home
/ Nature & Environment / Climate Change / Fundamentals of Ocean Forecasting / Regional and In-Situ Data Contributions

Regional and In-Situ Data Contributions
Satellites see the surface; floats and buoys measure within. Discover the data that completes the ocean picture.
The last lecture covered atmospheric forcing. This one, again with Ebenezer Nyadjro, returns to the ocean and looks at the observations that feed a forecast – both the satellites watching from space and the in-situ instruments measuring within the sea, with a close look at what’s available regionally, including in Africa.
The lecture covers:
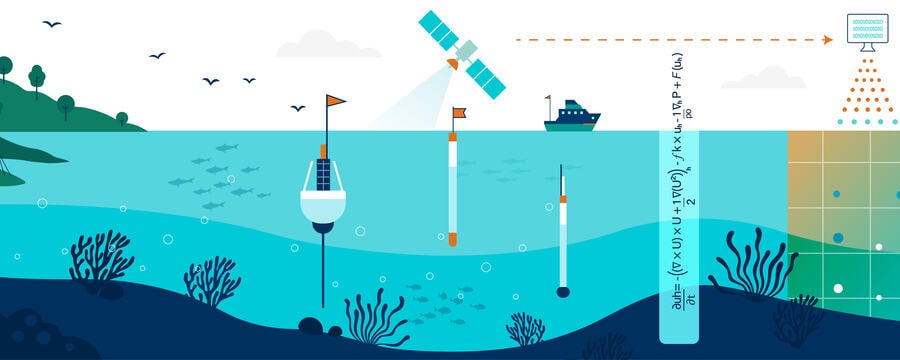
- Why observations matter – forecasts are sets of equations that must be fed with data to learn how the ocean varies and to predict its future. Observations are what monitor the ocean, initialize forecasts, validate model outputs, and improve forecast quality. In oceanography, “data” usually means three sources: in-situ measurements, satellite observations, and model outputs
- Satellite ocean observations – satellites provide sea surface temperature, sea level, ocean colour (and from it, biological signals like chlorophyll), surface winds, and sea ice. The lecture explains processing levels – from raw Level 1, through corrected Level 2 and gridded Level 3, to Level 4 products that merge many satellites into high-resolution, gap-free fields (like GHRSST for temperature and AVISO for sea level)
- The Copernicus Earth Observation Programme – the EU’s flagship programme, whose Sentinel missions monitor the atmosphere, land, ocean, and cryosphere with high spatial and temporal resolution, all freely available. A fine example: a Sentinel image of a river plume entering the ocean, used to study biology, sediment, and pollution
- SWOT – next-generation altimetry – the Surface Water and Ocean Topography mission (a NASA-CNES collaboration launched December 2022), which measures sea-surface height over a wide swath, resolving fine features like eddies, fronts, and coastal circulation
- Advantages and limitations of satellites – large spatial coverage, near-real-time updates, and consistent repeated observations, set against real limits: they mostly see the surface, and can suffer cloud contamination and radio-frequency interference, especially near coasts
- In-situ observations – direct measurements from buoys, Argo floats, tide gauges, and ships, reaching into the ocean interior that satellites cannot see, and the role of climatologies – long-term averages used where real-time data is scarce
- Observational challenges in Africa – the sparse in-situ networks along many African coasts, and why satellite and open-access data are especially valuable there
The takeaway: a complete ocean picture needs both families – satellites for broad, consistent surface coverage, and in-situ platforms for depth and detail – and knowing which regional and open-access sources exist is what lets a forecaster fill the gaps. The next step is learning to access these data yourself.