Welcome to Week 6: The forecast is only half the story
Welcome to Week 6.
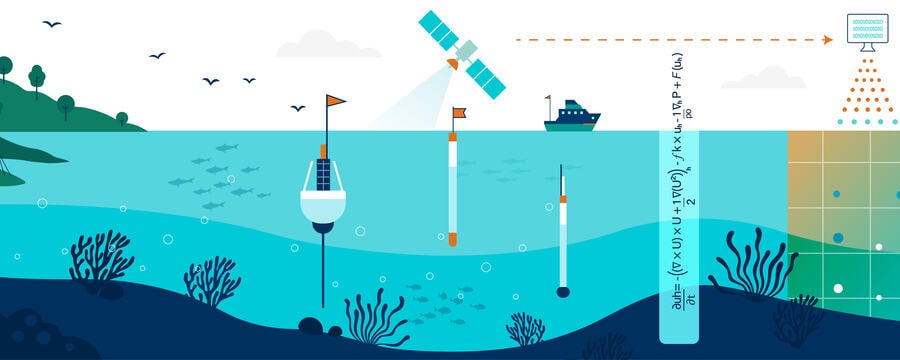
In the earlier weeks, you followed the ocean forecasting system as a whole – the virtuous loop that turns observations into models, models into products, and products into services. This week picks up right at the point where that system meets the people who use it: the moment a forecast product lands in front of someone who has to make sense of it.
Because producing a forecast is only half the story. A sea surface temperature map, a wave time series, a bulletin warning of a coming swell – none of these are useful on their own. They become useful only when someone can read them correctly, judge how far to trust them, and explain what they mean to the people who need to act. That skill is called forecast literacy, and it is what this week is about.
What you’ll learn
Forecast products can look intimidating – dense with colours, contours, arrows, and technical labels – but reading them follows a set of logical principles that anyone can learn. Over the week, you will build those principles up step by step:
- What forecast outputs are, and how they travel from models to users
- The key ocean variables you’ll meet in forecast products – temperature, sea level, currents, salinity, waves, and more
- How to read forecast maps – colour bars, gradients, anomalies, and vectors
- How to read time series and vertical profiles – change through time, and structure with depth
- Variability, anomalies, and uncertainty – telling normal from unusual, and knowing what a forecast can and cannot tell you
- How to communicate forecasts clearly and responsibly to the people who rely on them
Grounded in real regions
Interpretation is a practical skill, so you will practise it on real forecast-style products and on case studies drawn from African coastal systems – upwelling in the Gulf of Guinea, bloom monitoring in the Senegal–Mauritania region of the Canary Current, and marine hazard advisories in the Mozambique Channel. These are the kinds of conditions, challenges, and user needs that operational forecasters in the region meet every day.
By the end of this week
You should be able to:
- Interpret common operational ocean forecast products
- Understand spatial and temporal ocean variability
- Recognise uncertainty and the limits of what forecasts can say
- Identify important marine and environmental signals
- Communicate forecast information clearly and responsibly to diverse users
A word on how to approach it: interpretation is a skill you build by doing, not just by watching. Each video introduces a way of reading forecasts; the guided activities then put it straight into your hands. Take your time with the figures, and keep in mind the forecast product you found confusing in the discussion – by the end, you should be able to read it with real confidence, and help someone else read it too.