What the variables tell us
Before you can read a forecast map or chart, you need to know what it is actually showing. This reading introduces the core ocean variables commonly used in operational forecast systems, what each one represents physically, and why it matters – scientifically and operationally.
The core variables
Operational forecast products are built around a set of key ocean variables:
- Sea surface temperature (SST)
- Sea surface height / sea level anomaly (SSH / SLA)
- Salinity
- Ocean currents
- Winds
- Ocean colour
- Significant wave height
Each of these describes a different aspect of the ocean’s state, and each is delivered through forecast maps, time series, and profiles.
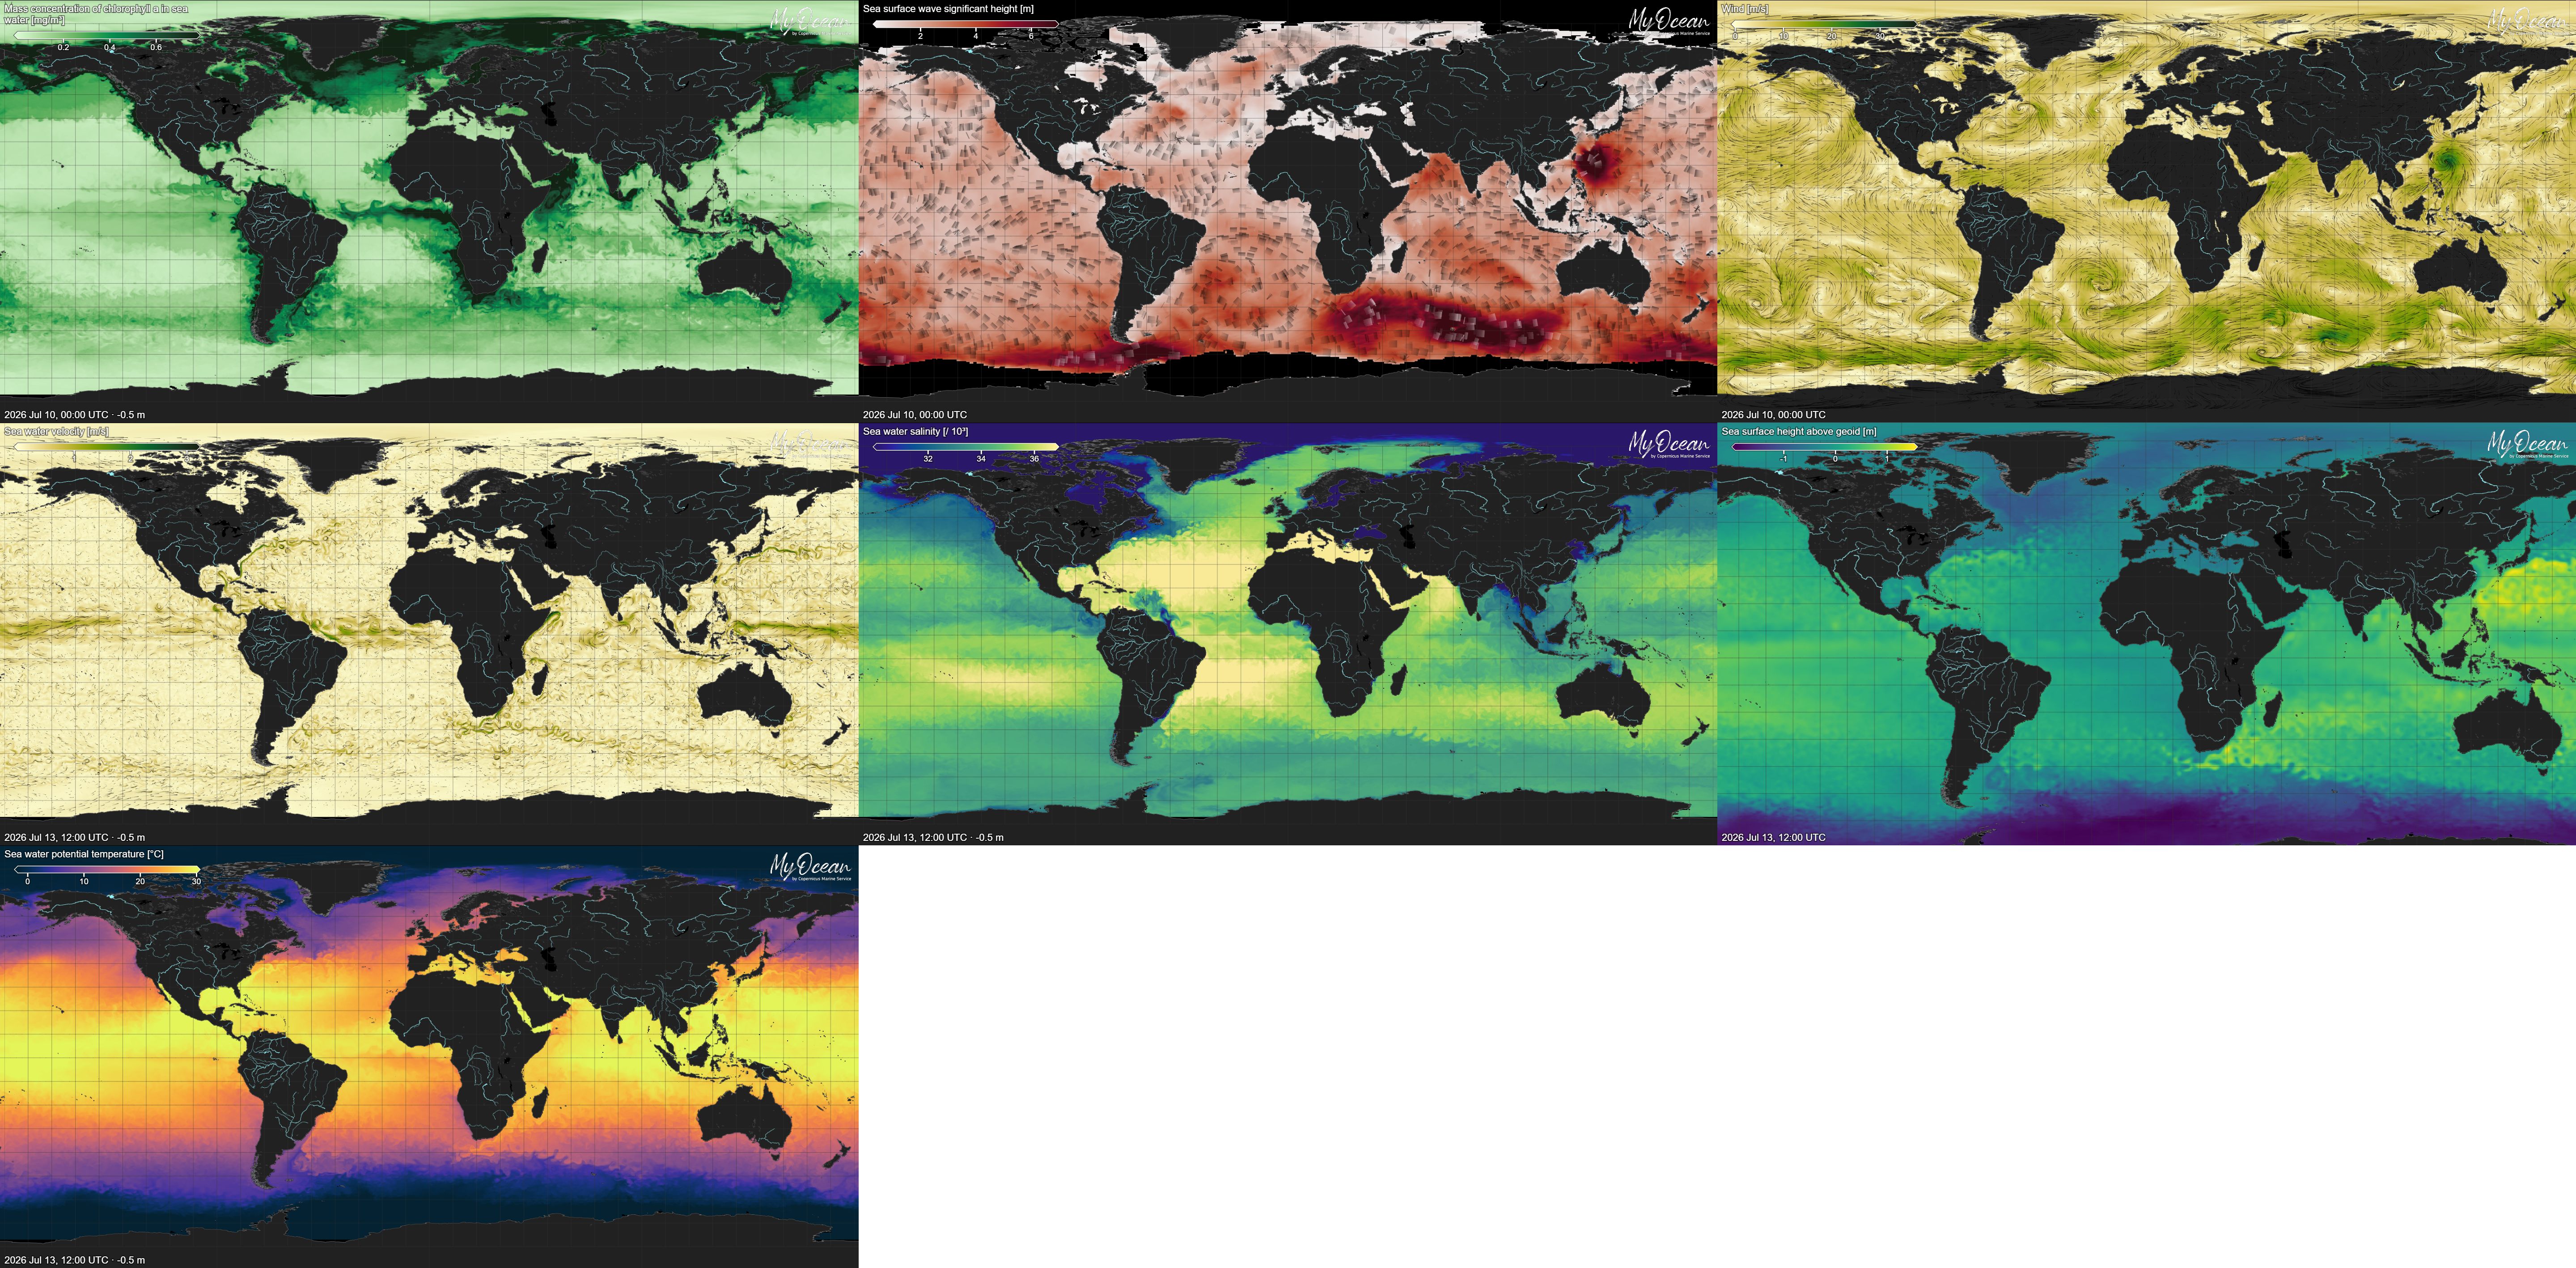 Figure 2: Each ocean variable has its own visual signature. Top row: chlorophyll-a (ocean colour), significant wave height, wind. Middle row: sea water velocity (currents), salinity, sea surface height above geoid. Bottom row: sea water potential temperature (SST). Source: MyOcean viewer, E.U. Copernicus Marine Service.
What each variable tells you
Every variable carries a specific physical meaning, and that meaning is what makes it useful in practice:
- Sea surface temperature (SST) helps identify ocean heat conditions, upwelling, and marine heatwaves.
- Ocean currents describe water transport and circulation.
- Sea level anomalies provide insight into flooding risk and ocean dynamics.
- Salinity helps characterise density structure and large-scale ocean circulation.
- Winds, ocean colour, and significant wave height complete the set shown in Figure 2 above – you’ll meet each of them again as you work through this week’s forecast products.
Together, these variables let forecasters describe not just how warm or high the sea is, but how it is moving, how it is layered, and where conditions are departing from the normal.
Where the data comes from
These variables do not appear from nowhere – they are supplied by a network of observational systems and satellite missions that feed operational forecasting applications. Understanding which observing systems provide which variables helps you judge how a forecast product was built, and what lies behind the numbers you interpret.
Why this matters for interpretation
Knowing what a variable represents is the first step in reading any forecast product correctly. A map of SST, a time series of sea level anomaly, and a profile of salinity each demand that you first understand the quantity being shown – what it measures, and why it matters. In the next activity, you’ll begin reading these variables directly from forecast maps.