Reading time series and vertical profiles
Maps show you where something is happening. But two other questions matter just as much: when is it changing, and what is happening below the surface? Time series answer the first, vertical profiles the second. This reading builds the skill of reading both.
Reading time series
A time series displays how a variable changes at a fixed location over time. A single time series can contain long-term trends, seasonal cycles, short-term variability, and extreme events all at once – which is exactly what makes them powerful, and what makes them worth reading carefully.
 Figure: Example of an oceanographic time series. Such figures may contain long-term trends, seasonal cycles, short-term variability, and extreme events simultaneously. Source: Berkeley Earth (https://berkeleyearth.org/july-2023-temperature-update/).
Time series are useful for identifying trends, seasonal cycles, short-term variability, and extreme events. When you read one, ask yourself:
- Is there a long-term increase or decrease?
- Is there a repeating seasonal cycle?
- Are there sudden spikes or abrupt changes?
- Is the variability itself increasing or decreasing?
This kind of reading is central to monitoring climate variability, marine heatwaves, coastal flooding, and the performance of operational forecasts.
Trends versus variability
One of the most important interpretation skills of all is distinguishing a long-term trend from short-term variability. They look similar on a chart, but they mean very different things.
A trend is a persistent, directional change over a long period. Variability is the shorter-term fluctuation around the average state – things like seasonal cycles, storms, intraseasonal oscillations, and interannual events such as El Niño.
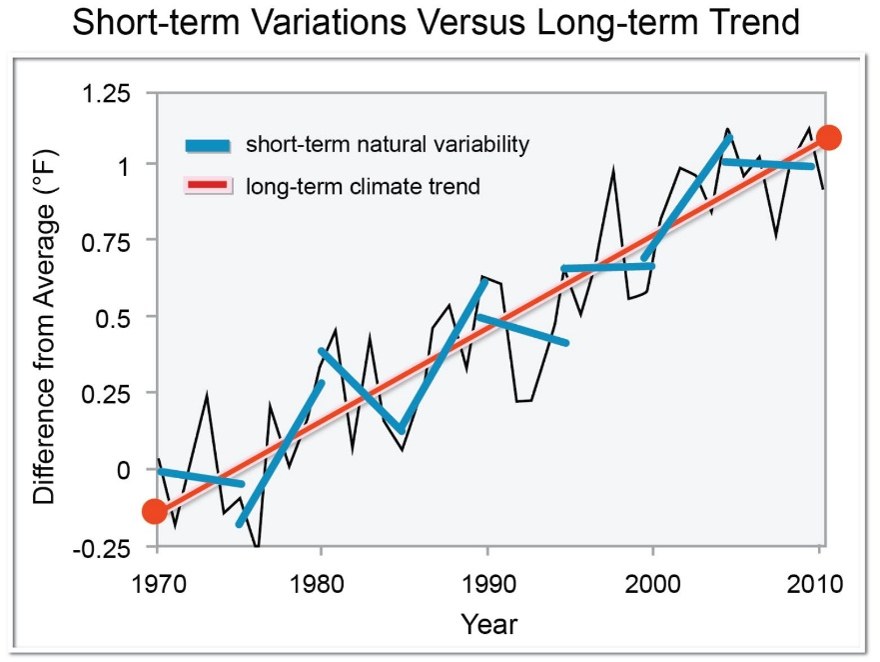
Figure: Environmental time series commonly contain both persistent long-term changes and shorter-term fluctuations. Short-term variability may temporarily mask or exaggerate the underlying trend. Source: U.S. Global Change Research Program (globalchange.gov).
This distinction has real consequences. A short warming event does not automatically indicate climate change; equally, a short cooling event does not invalidate a long-term warming trend. Reading a time series well means looking at both the short-term fluctuations and the broader context.
Looking at a figure like this, ask:
- Is there an overall long-term trend?
- What types of short-term fluctuations are visible?
- Does variability obscure the trend at certain times?
- Which changes appear temporary, and which persistent?
- Why is long-term context important?
Reading vertical profiles
Vertical profiles show how ocean properties change with depth – the dimension a surface map can never reveal. Common profile variables include temperature, salinity, density, chlorophyll, and dissolved oxygen.
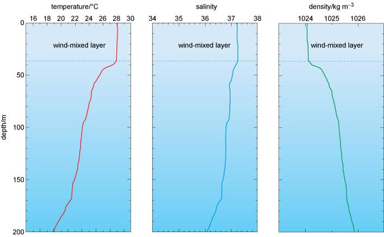
Figure: Vertical profiles display how ocean variables change with depth. The near-surface mixed layer is often relatively uniform, while the thermocline marks the depth range where temperature decreases rapidly. Source: The Open University (https://www.open.edu/openlearn/).
Profiles are especially important for understanding stratification, thermocline structure, mixed layer depth, and subsurface water masses. Two features to recognise: the mixed layer, usually marked by relatively uniform temperature near the surface, and the thermocline, the depth region where temperature changes rapidly.
Why does this matter? Because surface observations alone can be misleading. Two regions with the same sea surface temperature may have very different subsurface structures and heat content – and only a profile reveals that.
Reading a profile, ask:
- Where is the mixed layer located?
- Where does temperature begin changing rapidly?
- Which region appears most stratified?
- How does the profile change with increasing depth?
- Why are subsurface measurements important?
Bringing it together
Maps, time series, and profiles are three views of the same ocean, each answering a different question – where, when, and with depth. A forecaster rarely relies on just one. Read together, they turn scattered numbers into a full picture: where a feature sits, how it is evolving, and what lies beneath the surface.