Welcome to Week 7: where forecasts meet the real world
Welcome to Week 7 – the final week of the course.
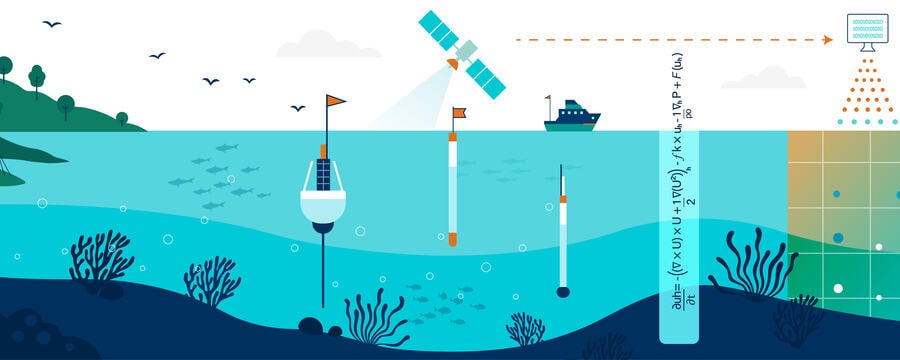
Across this course, you’ve followed the ocean forecast from the ground up: the physics of the ocean, the models that simulate it, the observations and data that feed them, and the forecast outputs those systems produce. This week closes the loop. It’s about what happens after a forecast is made – how it becomes a product, a service, a warning, a decision that matters to real people on real coastlines.
This is the downstream end of the End-to-End Ocean Forecasting System (EEOFS): the step where scientific production turns into societal benefit. A forecast that never reaches a fisher, a port authority, a disaster-management agency, or a coastal community is a forecast that hasn’t yet done its job. This week is about making sure it does.
From interpreting forecasts to applying them
In the previous week, you learned to interpret forecast outputs – to read them and judge how far to trust them. This week goes one step further, to application: who uses forecasts, for what, and how the science connects to their needs and decisions. The emphasis shifts from the forecast itself to its impact – on risk reduction, sustainable management, and social and economic development, with particular attention to African and regional contexts.
What you’ll explore
The week moves from the general idea of downstream applications through the major sectors that depend on them:
- From forecasts to services – what “downstream applications” actually are, and where they sit in the forecasting chain
- Understanding user needs – who uses ocean forecasts, and why understanding their needs shapes the products a service delivers
- Risk reduction and safety – early warning systems, maritime safety, and coastal hazard forecasting
- Sustainable fisheries and coastal management – supporting resource management and the ecosystem services communities depend on
- Marine pollution and environmental response – oil spills, water quality, and emergency response
- African and regional case studies – real-world examples where ocean forecasting delivers societal impact
By the end of this week
You should be able to:
- Explain how ocean forecasts are transformed into downstream applications and services
- Identify key socio-economic sectors that use ocean forecast information
- Understand how ocean forecasting supports risk reduction and sustainable resource management
- Illustrate applications through African and regional case studies
- Explain the link between scientific outputs, user needs, and societal benefits
A word on how to approach the week: it’s the payoff for everything that came before. Every concept you’ve learned – models, observations, assimilation, data sources, interpretation – exists ultimately so that someone can make a better decision about the ocean. As you go through this week, keep asking the question that drives all downstream work: who needs this forecast, and what will they do with it? Answer that, and you understand what ocean forecasting is really for.
Completing this week – and its final assessment – also completes the course. This is the last step toward your certificate, and toward closing the full end-to-end loop, from the physics of the sea to the services that protect and sustain the people who depend on it.