Publication bias (Part 2)
Statistical test of assessing publication bias
Deciding on funnel plot symmetry shouldn’t rely on visual inspection alone; statistical tests like Egger’s test and Begg’s test are more reliable.
Both tests are commonly used to assess funnel plot asymmetry, providing more objective measures. They evaluate if trial estimates relate to trial size, with specific significance levels to determine the presence of bias.
Begg’s and Egger’s test recommend the use of a very moderate significance level (p<0.1) because the number of trials included in a systematic review or meta-analysis is generally small and this limits the statistical power of the test. Begg and Egger’s test indicates p >0.1 as no possibility of publication bias.
Begg’s test
Begg’s test evaluates whether there is a systematic association between the effect sizes of studies and their standard errors, which can indicate the presence of publication bias. Begg’s test is based on Kendall’s rank correlation coefficient. It examines the correlation between the ranks of effect sizes and their standard errors across studies in a meta-analysis.
In this example, we use Begg’s test to identify publication bias in trials of corticosteroids for severe sepsis and septic shock (Annane D, 2004). The plot shows the relationship between log odds ratio and meta-analysis weight, highlighting the issue of variance not being the same for all points.
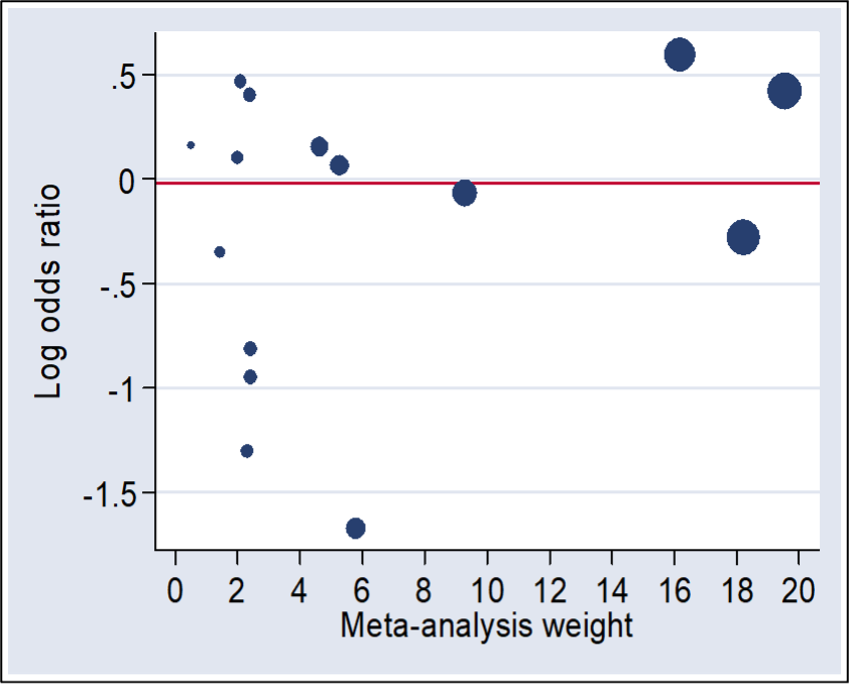
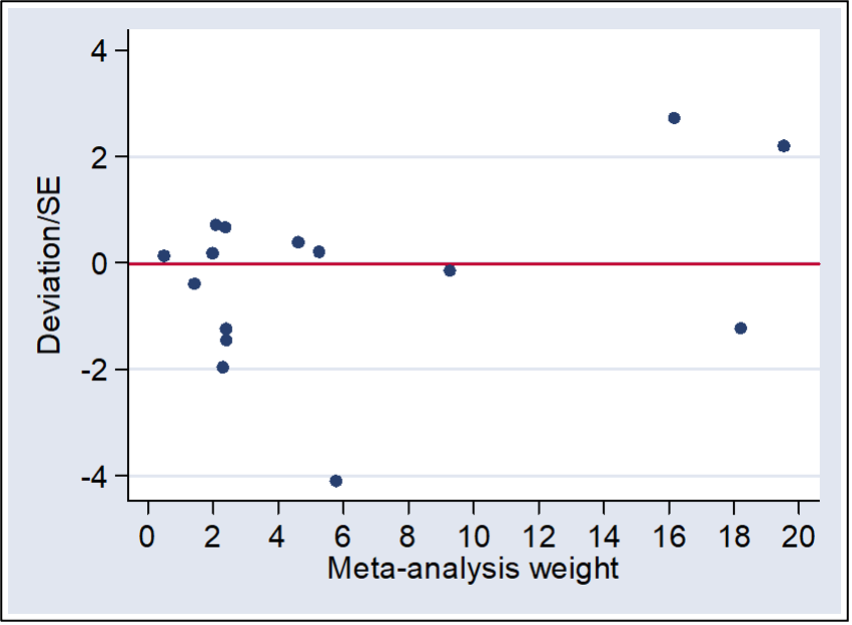
The problem of variance inconsistency is addressed by dividing each estimate by its standard error (SE). Begg’s method subtracts the pooled estimate first and then divides it by the SE of the deviation. Next, Kendall’s rank correlation between deviation/SE and weight is found. In this case, the correlation is not significant, with a Tau value of 0.09 and a P value of 0.7.
Egger’s test
Egger’s test uses linear regression to assess asymmetry in funnel plots, with intercept values indicating potential bias. A significant slope different from zero in a funnel plot indicates asymmetry, suggesting potential bias in the data.
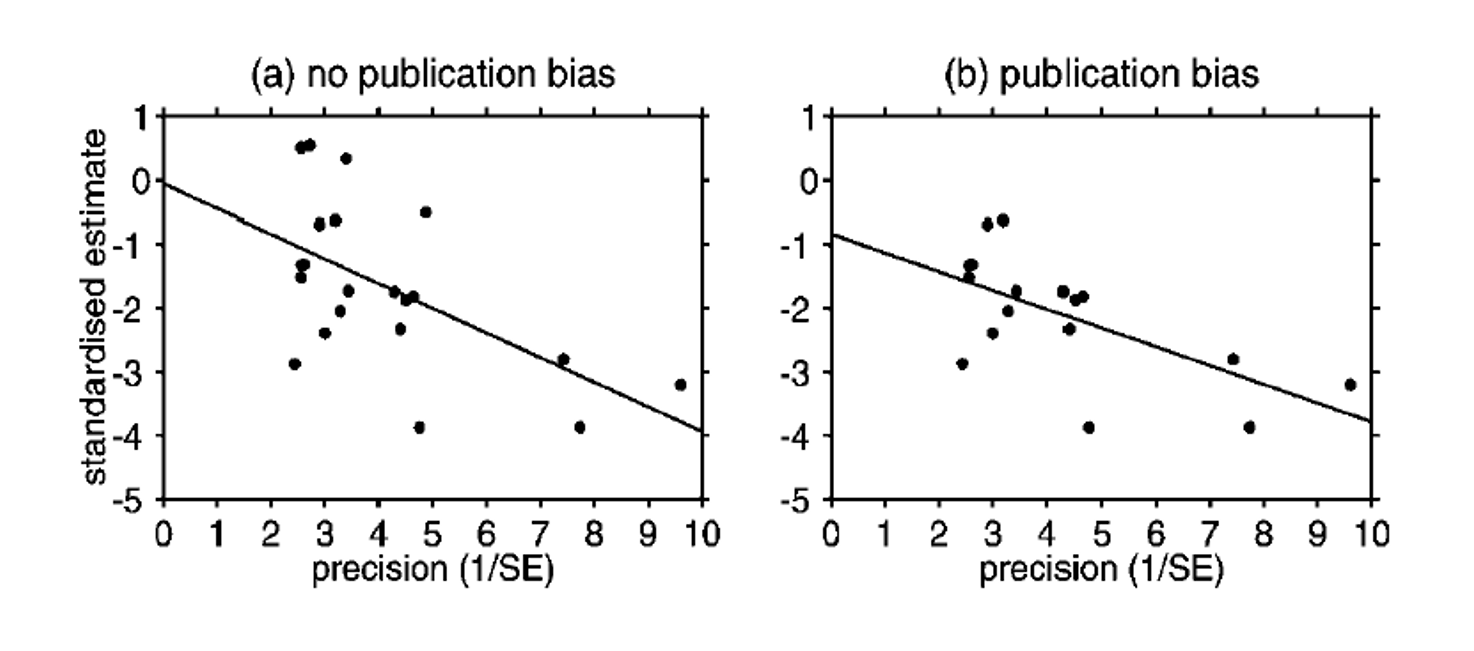
In some situations (for example, if there are several small trials but only one larger study) power is gained by weighting the analysis by the inverse of the variance of the effect estimate. The variance is not the same for all points, which can be problematic.
Egger’s test can perform both weighted and unweighted analyses and use the output from the analysis yielding the intercept with a larger deviation from zero. The comparison of unweighted and weighted analyses reveals variations in intercept values, emphasizing the need for careful consideration in meta-analysis.
References:
• Egger M, Davey Smith G, Schneider M, Minder C. Bias in meta-analysis detected by a simple, graphical test. BMJ. 1997 Sep 13;315(7109):629-34. doi: 10.1136/bmj.315.7109.629. PMID: 9310563; PMCID: PMC2127453.
• Lin L, Chu H. Quantifying publication bias in meta-analysis. Biometrics. 2018 Sep;74(3):785-794. doi: 10.1111/biom.12817. Epub 2017 Nov 15. PMID: 29141096; PMCID: PMC5953768.
• Lin L, Chu H, Murad MH, Hong C, Qu Z, Cole SR, Chen Y. Empirical Comparison of Publication Bias Tests in Meta-Analysis. J Gen Intern Med. 2018 Aug;33(8):1260-1267. doi: 10.1007/s11606-018-4425-7. Epub 2018 Apr 16. PMID: 29663281; PMCID: PMC6082203.
• Annane D, Bellissant E, Bollaert PE, Briegel J, Keh D, Kupfer Y. Corticosteroids for severe sepsis and septic shock: a systematic review and meta-analysis. BMJ. 2004 Aug 28;329(7464):480.)
Mastering Evidence-Based Practice: Systematic Review and Risk of Bias Assessment


Mastering Evidence-Based Practice: Systematic Review and Risk of Bias Assessment