Skip main navigation

New offer! Get 30% off one whole year of Unlimited learning. Subscribe for just £249.99 £174.99. New subscribers only. T&Cs apply

Find out more

The Shape of Epidemics

Epidemics have a characteristic shape. See how this shape can be modelled.
Screen shot of the simulation program used on the course showing the graphs of numbers of people susceptible, infected and recovered.

The first thing to do when modelling a real world system is to look at it and abstract the most important features. For epidemics the fundamental things is the population. Let this be represented by the symbol (P).

For the COVID-19 system another fundamental feature is the people who are sick or die from the virus. At any point in time let the symbol (I) represent the number of infected people.

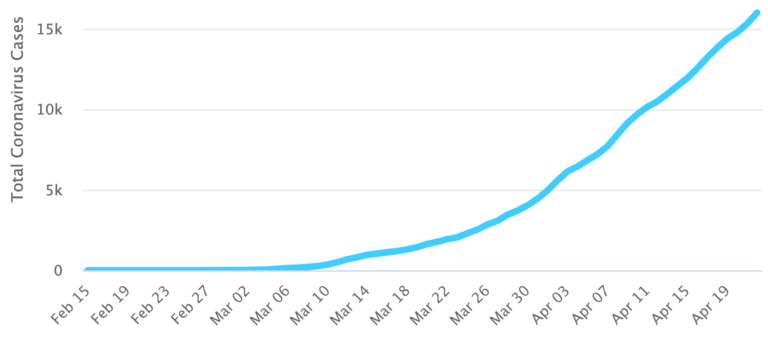
The number of people infected can be found on the www.worldometers.info website. This site presents the World Health Organisation’s data for many countries in the world. The data for Sweden are shown in Figure 6.1.

Figure 6.1. Number of COVID-19 cases in Sweden to 22nd April 2020 Graph of the number of people infected by COVID-19 in Sweden to 22nd April 2020.

Assume that “When a person gets infected by a virus, they create antibodies that kill the virus and this enable them to recover. These antibodies prevent further infection”. In other words the people who have recovered from a virus cannot be reinfected. According to fullfact.org, an independent fact-checking website, it’s very rare to catch Covid-19 twice. This means there is a set of people who have recovered from the virus. Let this be represented by the letter (R).

What about the people who are not infected and not recovered? They are susceptible to being infected. Let the set of these people be represented by the letter (S).

Already we have enough to formulate a simple model:

Let (P) be the population at the start of an epidemic

Let (I) be the number of people infected on a given day

Let (R) be the number of people recovered on that day

Let (S) be the number of people who are susceptible on that day.

Then (P = S + I + R).

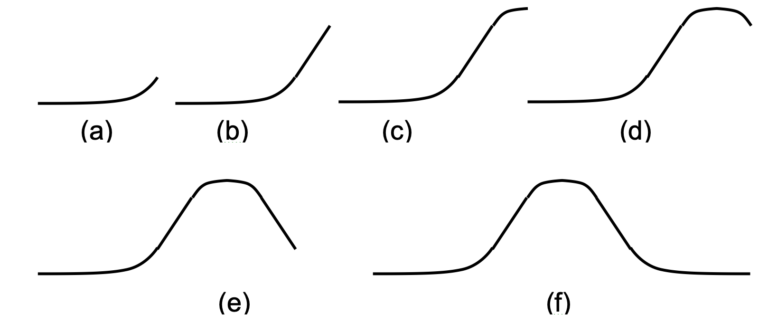
Already this “SIR” model can tell us something about epidemics. Initially assume that (I) begins to increase rapidly in time (Figure 6.2(a)). A UK Government leaflet suggests that after nine days people have recovered and are no longer infectious [2]. extract from a government leaflet showing people recover after nine days Since (R) increases and (I) decreases, (I) can’t keep rising so steeply and has to flatten off (Figure 6.2(b)) and then turn down until it’s horizontal (Figure 6.2(c)). Then by a similar argument it has to turn down until the number of infected people is around zero Figure 6.2(d)(e)(f)).

Figure 6.2. Building up the infected curve for epidemics A sequence of six images showing the trajectory of the fundamental curve for epidemics

By making the assumption that day by day the numbers change smoothly, this curve is be similar to the curve shown at the top of the page. So, by making a few assumptions we have built a simple mathematical model, (P = S + I + R), that is close to the classic Kermack–McKendrick model of epidemiology. This is the curve that everyone talks about flattening.

What do you think

If you never built a model before do you think you could follow this simple approach? Do you think that this model may be too simple to be useful?

Reference

[1] fullfact.org, It’s very rare to catch Covid-19 twice, viewed 23rd April 2020. https://fullfact.org/health/coronavirus-catch-twice/

https://assets.publishing.service.gov.uk/government/uploads/system/uploads/attachment_data/file/877678/coronavirus-leaflet.pdf

© UNESCO UniTwin CS-DC & The Open University
This article is from the free online

COVID-19: Pandemics, Modelling, and Policy

Created by
FutureLearn - Learning For Life

Reach your personal and professional goals

Unlock access to hundreds of expert online courses and degrees from top universities and educators to gain accredited qualifications and professional CV-building certificates.

Join over 18 million learners to launch, switch or build upon your career, all at your own pace, across a wide range of topic areas.

Start Learning now