Skip main navigation

New offer! Get 30% off one whole year of Unlimited learning. Subscribe for just £249.99 £174.99. New subscribers only. T&Cs apply

Find out more

The Cherryville Protest Model

In this article, we are going to describe the protest model developed in order to study the Cherryville protest in more detail putting stress on the process of modelling itself.
Making Decisions When Creating A Model
© ACTISS

In this article, we are going to describe the model developed in order to study the Cherryville protest in more detail putting stress on the process of modelling itself.

Now we are going to systematise the description of a model ordered by Cherryville authorities in the context of your knowledge about modelling. In the process of modelling we need to make several assumptions about reality and choose which elements are important from our point of view.

Making The Cherryville Protest Model

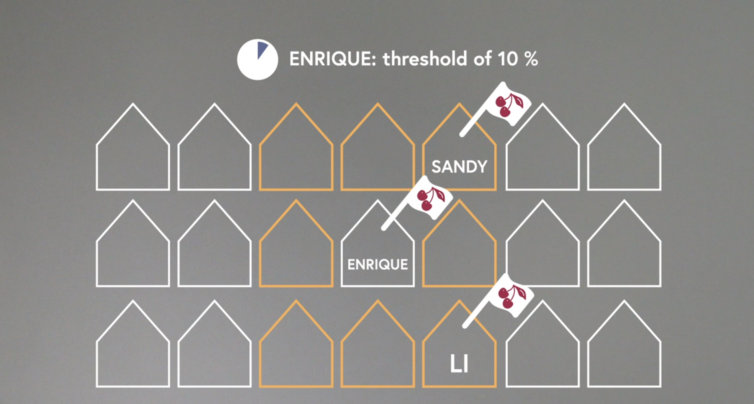
How does it look like in the case of a model of protest in Cherryville? An expert probably started from the construction of the village. She decided that it would have a shape of a rectangle and it would be divided into small squares, which makes it similar to a chessboard. In every square, there is one house (with one citizen).

Assumptions of the Cherryville Protest Model

What about Cherryville citizens? We are sure that you noticed that they don’t have many features, which real people have. What features do they have and what can they do? People in the model live in their houses, they have a specified threshold and they are protesting or not. “To protest” in practice means to hang a flag on their house, which means that on every house there can be a maximum of one flag.

That is all – not a lot, don’t you think?

House with a flag of Cherryville and threshold of 50%

There is one more assumption of our expert, which is quite important in all models which illustrate processes that spread spatially. It is an assumption about a neighbourhood. Every place on the chessboard is surrounded by another 8 places. It means that every house can have 8 neighbours.

Protest Thresholds

And when a resident who is in the center of such a neighbourhood, is deciding to protest or not, he will take into account the situation in those houses according to his threshold. When the percentage of neighbours who protest is equal or higher than this resident’s threshold he or she will also hang a flag. Otherwise, the resident will not do it. And exactly the same thing will happen with all other citizens of modelled Cherryville – each of them is looking at his or her neighbours, comparing the percentage of houses with flags with his/her threshold and making a decision about joining a protest.

As you can see several decisions were made in the process of creating the model:

  • what are the characteristics of the area and of the individuals?
  • what options do they have?
  • how do they make their decisions?

How do Researchers Make Such Protest Model Decisions?

In general, which is probably not the most desirable answer, it all depends. We talked about it a bit. Are you familiar with the crash test dummy? We said that a lot depends on a problem and the process that we want to illustrate by a certain model. It also depends on the purpose of the model. If we want to have a simple illustration of the basic mechanism, we should have as few elements as possible and as simple as possible. And if we want to make a realistic model, we need to be more specific.

Sometimes we just have to make some technical assumptions. For example, in the case of neighbourhood, we can also imagine that an expert could make a different decision and for example decide that she will treat as neighbours only four nearest houses

Three rows and three columns of schematic houses. The houses in the corners and the house in the centre (2nd column, 2nd row) is white. The house in the centre has bold borders. Other houses are light brown

Sometimes we can also make a simple model and develop it by adding more elements. We can also try out different solutions and see what works best.

© ACTISS
This article is from the free online

People, Networks and Neighbours: Understanding Social Dynamics

Created by
FutureLearn - Learning For Life

Reach your personal and professional goals

Unlock access to hundreds of expert online courses and degrees from top universities and educators to gain accredited qualifications and professional CV-building certificates.

Join over 18 million learners to launch, switch or build upon your career, all at your own pace, across a wide range of topic areas.

Start Learning now