
Introduction to NetLogo

Let’s start with a definition.
What is NetLogo?
NetLogo is the name of a quite simple language with which we can build models. It is also a name of a platform where you can find many ready-made models, interact with them and analyse them. If you want to find out more about this language and the platform, you can read it on the NetLogo webpage.
For now, only a few mentions are important and useful.
In the image below, you can see how a NetLogo simulation appears. On the right, you can see a town seen from a bird’s eye view, just like the ones from the previous steps.

There are some sliders there as well, for example, here you can use a slider to decide how many initiators will live in your city.
If you want to initiate the simulation you need to click on “setup”. That way you will get the initial state. Every time you click “setup” you will get a somewhat different initial state because the exact positions of the residents and distribution of initiators are selected randomly. The thresholds of citizens are also randomly selected.
Pressing the “Go” button will start the simulation. Residents will make a single decision to join the protest or not on the basis of their threshold and status of their neighbours. If you press it again and again you will see more decision steps.
As it would be quite tiring to press this button 100 times, instead you should click “Go ↺” then you will see more steps, and the simulation will be “live” until everyones stops making decisions. How fast it will go depends on the position of the slider “model speed”.
Under the picture, you will always see a plot. It will show you how many % of residents are protesting. It will help you observe the dynamics of the protest. In the picture, you can see how the model looks after 100 decision steps (in language of models called iterations).
You can see that there are definitely more purple clusters and on the plot you can also observe that at some moment the % of protesters were quickly growing, although after a few steps growth stopped and stabilised to a certain level.
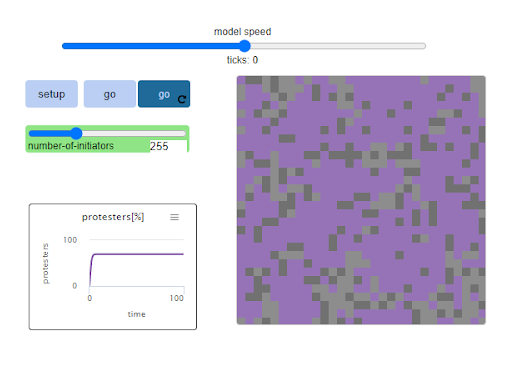
If you want to know the exact number of steps and the percentage (%), you should position the cursor on the plot, the first number is the number of iterations and the second is the percentage (%) of residents who are protesting. In our example, it is the eighth iteration and the percentage is 69%.
The general rules of NetLogo
So, the general rules are that:
- SETUP gives us our “initial conditions”, meaning a starting point.
- GO starts the simulation and takes us one step ahead
- GO ↺ will make our simulation run and unfold until the process stabilises (or until we click it again to make the process stop).
- a slider (here: number-of-initiators) enables us to decide on some characteristics of the situation.
- model speed – sets up how fast the process will unfold
- plot can help track down how the process unfolds and what results we get.
People, Networks and Neighbours: Understanding Social Dynamics


People, Networks and Neighbours: Understanding Social Dynamics
Reach your personal and professional goals
Unlock access to hundreds of expert online courses and degrees from top universities and educators to gain accredited qualifications and professional CV-building certificates.
Join over 18 million learners to launch, switch or build upon your career, all at your own pace, across a wide range of topic areas.


