
Thatcher’s Macro Policy: Monetarism and the ‘Natural Rate’ Hypothesis

In this article, Professor Kevin Lee describes Friedman’s ‘Natural Rate’ Hypothesis in a little more detail and the profound impact it had on macroeconomic policy-making as exemplified by Thatcher’s first government in 1979.
Thatcher’s rise to leadership of the Conservative party through the seventies, and her election to power in 1979, coincided with an important shift in macroeconomic thinking. In policy terms, this moved from an emphasis on demand management by government – though active monetary and fiscal policy – to a focus on the supply side and the idea of a “natural” rate of output determined primarily by the working of the free market.
The importance of the shift is illustrated in the diagrams below.
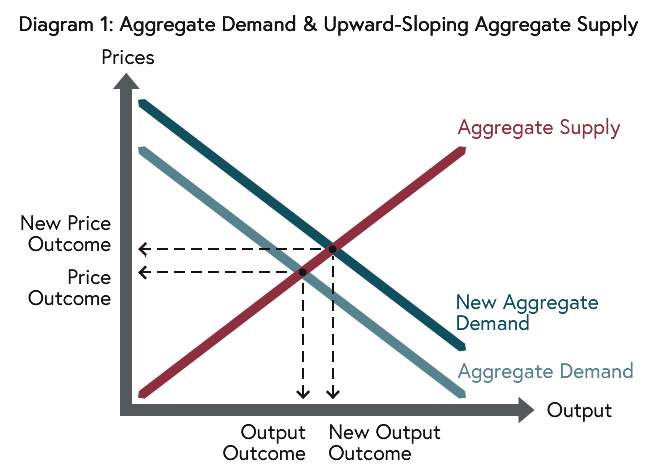 Diagram 1: Aggregate Demand & Upward-Sloping Aggregate Supply
The downward-sloping Aggregate Demand (AD) curve summarises the demand for goods, services and equipment from consumers at home and abroad, from firms and from government. Demand goes up as prices fall as shown by the downward-sloping curve. Expansionary fiscal policy is achieved by more government spending or tax cuts; expansionary monetary policy involves increasing the money supply and/or cutting interest rates to boost consumption and investment spending. ‘Monetarists’ emphasised the use of monetary over fiscal policy but in any case expansionary policies move the AD curve to the right so that more output is demanded at any price. Output and prices are determined where AD and Aggregate Supply (AS) are equal and in diagram I, with an upward-sloping AS curve, fiscal and monetary policy expansion causes output (and prices) to rise.
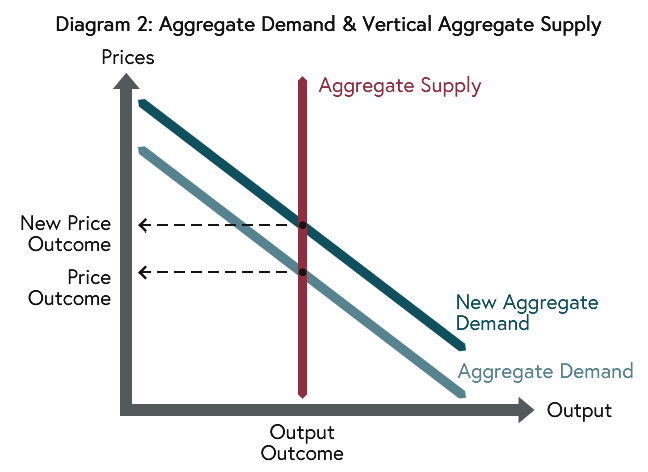 Diagram 2: Aggregate Demand & Vertical Aggregate Supply
In diagram II, where the AS curve is vertical at the “natural” level, policy expansion just causes price rises. The shift in emphasis in policy-making in the seventies, as embraced by Thatcher, reflected an increasing belief that the post-war consensus in which governments should actively pursue growth strategies through demand management was flawed and that Diagram II is a better characterisation of the macroeconomy than Diagram I.
But what determines whether the AS curve is upward-sloping or vertical? The AS curve summarises how prices impact on the three factors that determine how much output is produced in the economy. These are: (i) firms’ profit-maximising decisions on how much to produce and how many workers to employ; (ii) workers’ desire for work; and (iii) the available technology that converts workers’ efforts into output. Let’s take these in turn:
- Profit-maximising firms choose how much to produce based on their costs and the price they can charge for their product. If the price rises (with costs unchanged), a firm will exploit the improved conditions and take on more workers. Of course, if wage and other costs rise at the same time and at the same rate as prices, then the firm will not alter its demand for workers or its output; as far as firms’ demand for labour is concerned, it is the real wage – the £-wage relative to the price of output – that matters in firms’ decision-making (so labour demand rises as the real wage falls through falling £-wages or rising prices).
- Workers’ decisions on how much to work depends on many things but the wage paid is key and the supply of labour will rise – with individuals working longer hours and new individuals joining the workforce – as wages go up. Of course, workers are not interested in the money for its own sake but for what it can buy. If prices rise at the same time and at the same rate as the £-wage, so that the extra £’s just deliver the same goods and services, workers will not supply more labour; it is the real wage that matters in their decision-making too (so labour supply falls as the real wage falls).
- Production methods and management techniques influence the AS curve because these determine how workers’ efforts are translated into output. The total number of workers employed is determined in the labour market where the demand for labour equals the supply of labour (at N* in the diagram).
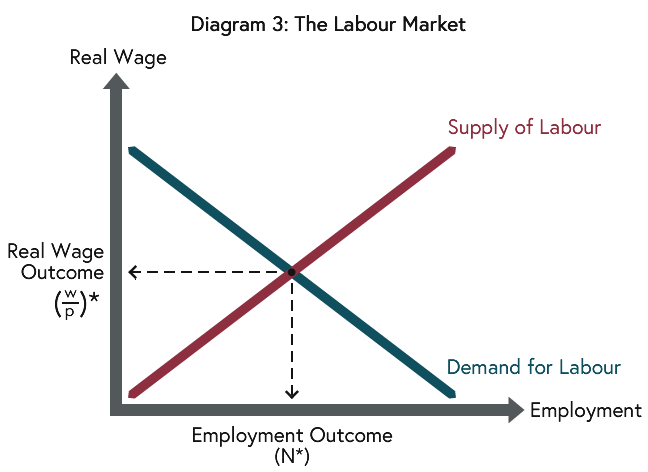 Diagram 3: The Labour Market
With given technologies, this converts into a particular output level and it is this output level – i.e. the one emerging when supply equals demand in the labour market – that Milton Friedman termed the “natural” level. Government policies on training, welfare, innovation and so on could influence production technologies and hence the natural level of output; but these supply side interventions are quite distinct from demand management (monetary and fiscal) policies.
So how do these three factors come together in the AS curve? Friedman argued that each firm would be fully aware of the price of their own products and their costs and so would always operate on their profit-maximising demand for labour curve. Individual workers on the other hand have to look at the prices of all goods (not just the ones they are involved in making) and so, while they know the £-wage that they take home, there is more ambiguity for them on the real wage they receive. Workers’ decisions are based on the expected real wage rather than the actual real wage and if prices rise more than is expected workers would supply more labour (with the ‘miscalculated’ labour supply curve sitting to the right of the ‘correct’ curve in the diagram). An unexpected rise in prices would result in employment and output rising as workers misjudge the buying power of their £-wage and firms react to the fact that they can take on more workers at a lower real wage.
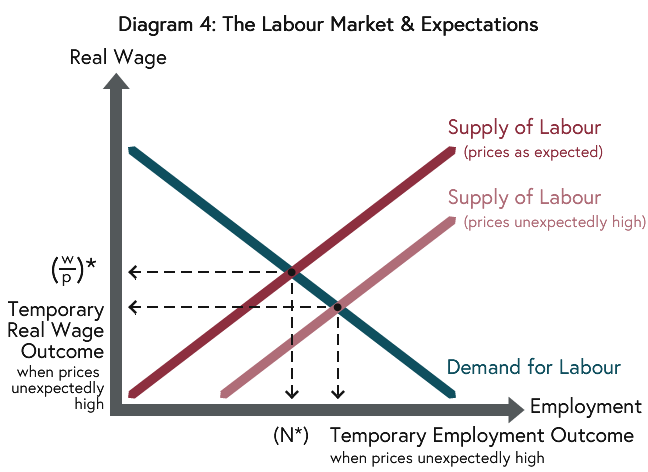 Diagram 4: The Labour Market & Expectations
But this cannot last for ever. Eventually workers will recognise the full extent of the price rise and then labour supply, employment and output would return to their natural levels. For the AS curve, this means we have an upward-sloping curve in the short-run, with higher prices associated with higher output as price expectations fall behind actual price, but a vertical AS curve in the long-run.
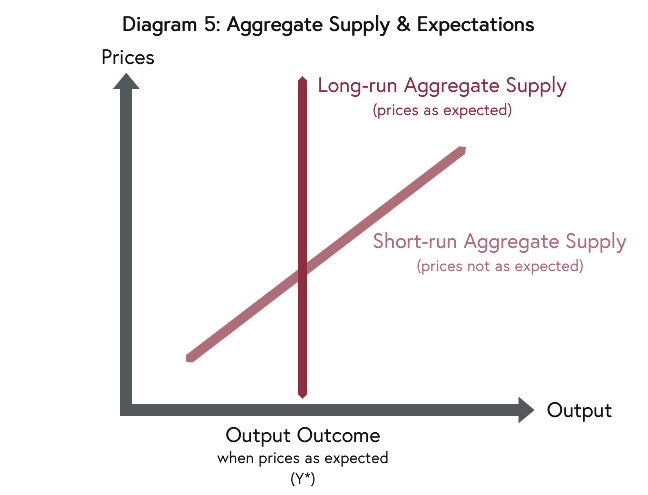 Diagram 5: Aggregate Supply & Expectations
Friedman acknowledged that expansionary monetary and fiscal policies could affect output in the short run but thought governments should refrain from using the policies in this way. A monetary policy boost that causes interest rates to fall unexpectedly, for example, would increase aggregate demand, push up prices and, while price expectations are unadjusted, increase output. But the policy impact would only be temporary and, eventually, would only show in higher prices with no long-run effect on output. Government might be tempted to try to permanently keep output above the “natural” level by successive demand boosts, but this would generate steadily rising prices and the output gains would always be offset eventually. Indeed, if everyone builds the expansionary boosts into their expectations, government would have to try ever-more-extreme expansions to keep price rises ahead of expectations, leading to no output gain in the long run but ever-accelerating inflation. With this in mind, Friedman proposed to abandon the use of demand management for influencing output and (un)employment and to use it to aim for a predictable low-inflation environment instead, concentrating on supply side policies if governments wanted to improve output.
For those who would like to read Friedman’s ideas in his own words, his 1968 paper is available here.
Kevin has written above that the Natural rate Hypothesis is based around three important assumptions: (i) that firms and workers are able to see through general wage and price increases and care only about relative wages and prices – sometimes expressed as not suffering from ’money illusion’; (ii) that wages adjust quickly to bring the supply and demand for labour into line; and (iii) that expectations adjust gradually to surprises but are eventually correct on average. Share in the comments how realistic you view these underlying assumptions ?
The Politics of Economics and the Economics of Politicians


The Politics of Economics and the Economics of Politicians
Reach your personal and professional goals
Unlock access to hundreds of expert online courses and degrees from top universities and educators to gain accredited qualifications and professional CV-building certificates.
Join over 18 million learners to launch, switch or build upon your career, all at your own pace, across a wide range of topic areas.


