
Site-Specific Fertilization

In this article, Anna Tsibart, Jérémie Haumont and Wouter Saeys from KU Leuven discuss site-specific fertilization.
Soil is a source for nutrients (N, P, K and others) required by plants, but the supply of those nutrients in natural soils is typically insufficient for obtaining high crop yields. For this reason, the addition of fertilizers is essential to meet crop requirements. In traditional farm management, fertilizer application is often based on average crop recommendations and a field is treated as one homogeneous area. This management strategy is fast and easy to implement making it attractive for farmers. However, agricultural fields can have large variability in nutrient supply. Therefore, homogeneous or blanket fertilizer application leads to over-fertilization in some areas and under-fertilization in others. Over-fertilization is harmful to the environment because it leads to increased nutrient runoff and leaching to ground and surface water. The latter induces eutrophication and loss of biodiversity. Next, over-fertilization also negatively impacts a farmer’s economic returns. On the other hand, under-fertilization induces soil exhaustion, reducing long term field productivity. For these reasons, site-specific nutrient management technologies are developed to maximize crop productivity while reducing environmental impact.
From satellite images to management zones
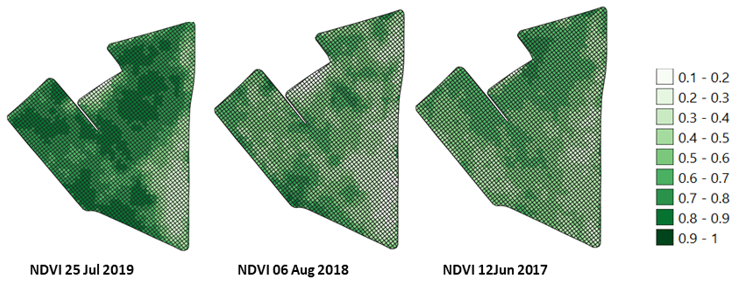
The first step is to identify field areas that have similar characteristics in terms of soil fertility and potential crop productivity. These areas are called management zones. For this purpose, remote sensing is a very useful tool. For the efficient delineation of management zones, the use of remote sensing technology plays an important role. For instance, satellite and drone images provide insight in the crop development over time, and its response to the lack of nutrients throughout a field. Information about vegetation status can be obtained from the images acquired by satellites. For example, the Sentinel-2 satellite launched In 2015 by the European Space Agency within its Copernicus program acquires images with a high resolution of 10x10m and each field is observed every 5 days. As these are made available to farmers at very low cost, they are very attractive for use in precision agriculture applications. As these satellites measure images at different wavebands, various vegetation indices can be calculated from those images. For example, the Normalized Difference Vegetation Index (NDVI) indicates the crop health in the field based on light reflectance at certain spectral bands. NDVI maps thus provide a lot of valuable information about the development patterns in the field. They could be used to locate “bad” and “good” zones. Especially in dry periods of the growing season, large spatial variability in the NDVI is observed. This is illustrated in Figure 1 for a grass field in Belgium where the NDVI maps acquired by the Sentinel-2 satellite in 3 different growing seasons are illustrated. These maps clearly shows areas with differences in vegetation which return over the years. This suggests that these zones in the field differ in the amount of available water or nutrients.
Figure 1: Historical NDVI maps for a grass field in Belgium, which show returning patters which can form the basis for defining management zones.
However, these indices are not sufficient to decide on the right actions to take in the identified zones, because they don’t give us insight in the cause of this variation. Therefore, they have to be complemented with additional sources of information.
Mapping Soil Fertility
For identifying zones which are stable in time and space, additional information about soil properties and topography of the field are required. Historically, the variation in soil texture was mapped through extensive sample collection and laboratory analyses. Samples were analysed in the laboratory and afterwards properties are mapped using interpolation techniques. Recently, soil sensing technologies are commercialized which allow to scan the soil while driving over it with a tractor equipped with an RTK-GPS to produce field-scale maps of soil pH, organic matter, electrical conductivity (EC) and height.
Figure 2: Mapping Soil Fertility
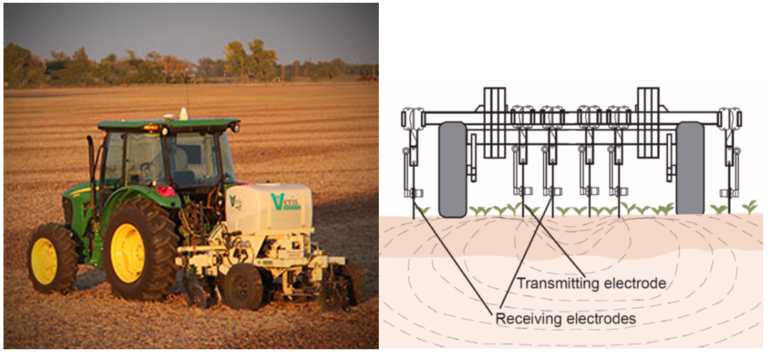
MSP3 soilscanner mounted behind a tractor and schematic overview of the working principle for measurement of electrical conductivity of the soil between transmitting and receiving electrodes integrated in the coulters (Veris Technologies, Salina, Kansas, https://www.veristech.com/).
The Veris soilscan sends electrical signals into the ground through rotating metal discs (coulters). Other discs that are placed at varying distances from the transmitting electrode are used to measure the signal. These measurements are performed while driving over the field. At carefully selected locations soil samples are collected to calibrate the sensors and link the measured signals to soil properties like the electric conductivity (EC) and organic matter (OM). Furthermore, the soils canner is also equipped with a pH probe to measure the pH at different locations throughout the field.
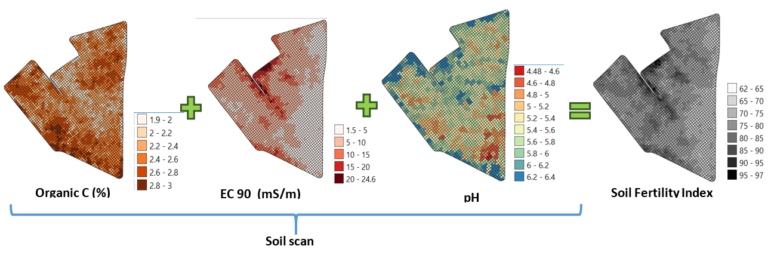
These measured properties are related to the soil fertility and can thus be used to define zones with higher or lower yield potential (Figure 2). For instance, soils with high organic matter content are considered to be more fertile, while most crops have an optimal pH range for growth. Next, the EC is related to soil texture, moisture content, nutrient status and amount of organic matter. In humid zones, higher electrical conductivity corresponds in most cases to more fertile areas. However, sometimes, a high EC could also be related to poor soil fertility. For example, this can be the case when very fine clay particles appear in the soil profile which affect the root growth and water retaining capacity. Based on this knowledge, these soil properties can be aggregated into one number, a soil fertility index, using formulae that are dependent on the soil type. This is illustrated in Figure 2. Dark zones in the soil fertility map correspond to fertile zones which correlate well with the zones where high NDVI values were observed.
Figure 3. Maps of soil properties measured with a soil scanner and soil fertility map calculated from it.
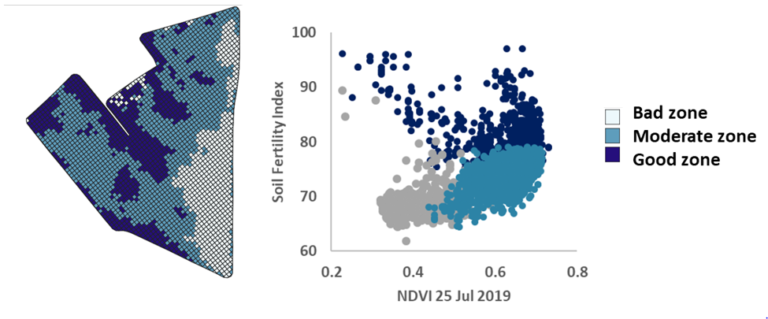
Subsequently, clustering algorithms are used to automatically detect different “homogeneous” zones in these maps. Those are then considered as the management zones for that each require a specific fertilization advice (Fig. 4). The optimal fertilizer dose for each management zone is then determined using a computer based decision support systems (DSS).
Figure 4: Management zones based on NDVI and soil properties
Conclusion
Remote sensing (satellite and drone imaging) and high resolution soil characterisation are valuable tools to identify different zones within a field that each require a tailor made fertilization advice. This approach allows to improve crop productivity while protecting the environment through improved fertilizer use efficiency.
Acknowledgements
The maps included in this article were made in the context of the project “Precision fertilization with animal manure”, a collaboration of KU Leuven, Belgian Soil Service and the Hooibeekhoeve, funded by Flanders Innovation and Entrepreneurship (HBC.2018.22.30).
Revolutionising the Food Chain with Technology


Revolutionising the Food Chain with Technology
Reach your personal and professional goals
Unlock access to hundreds of expert online courses and degrees from top universities and educators to gain accredited qualifications and professional CV-building certificates.
Join over 18 million learners to launch, switch or build upon your career, all at your own pace, across a wide range of topic areas.


