This course is part of the Data Analysis with Excel for Complete Beginners ExpertTrack
Data Visualisation Fundamentals for Absolute Beginners
Gain an introduction into data visualisations to communicate your data analytics to a diverse audience.

Duration
2 weeksWeekly study
5 hoursIncluded in an ExpertTrack
Course 3 of 4
Data Visualisation Fundamentals for Absolute Beginners
Data visualisations are ongoing proof that a picture is worth a thousand words. Learning to effectively turn data insights into visual language is a highly sought-after skill, as businesses around the world struggle to turn their data into useful, digestible insights.
This course starts from scratch to teach you how to turn your data into a story that’s understood across your organisation. You will learn how to use the elements of visual design - line, shape, negative space, volume, value, colour and texture - and turn them into meaningful imagery that you can use to communicate with stakeholders, customers, and colleagues.
Improve your visual literacy
Rather than starting at chart types and ideas, you’ll build your understanding of visual literacy so that you can understand our instinctive responses to images and how to properly channel them into useful stories.
Learn to conduct visual analysis
Once you understand the basics of visual literacy, you’ll be able to analyse illustrations and data visualisations. This can help you improve your own visualisations and parse great visualisations you see to find ideas and inspiration.
Discover how to create data visualisations for your business
Finally, you’ll move onto creating data visualisations for your business. By now, you’ll understand what makes an effective visualisation and how to combine insights and design elements into presentations that make a real impact.
Syllabus
Week 1
Welcome to the Course


About this Course
This activity introduces you to the course outline and the learning outcomes, as well as information on navigating the course on the FutureLearn platform and your CloudSwyft Hands-on Labs.

Visualisations are Everywhere
In this activity, you'll be introduced to the concept of Visualisations

Visualisation Fundamentals
We're going to look at the fundamentals behind data visualisations. We'll explore data, basic statistics and the elements you'll use in your first charts.

Visuals for Comparing and Relating
It's easy to think about different ways to compare or relate different bits of data. In this section, we're going to see how we can use visuals to compare and relate data

Visuals for Interacting and Analysing Data
We'll be looking at using interactive visualisations to not only compare and relate data but to begin doing data analysis with visual artifacts.

Wrapping Up the Week
Congratulations, you've reached the end of Week 1. This week we learned about the basics of visualisations and how we can use visuals to compare, relate and analyse data.
Week 2
Business Visualisations and Visualisations of Tomorrow

Business Visualisations
In this activity, we'll introduce and describe the four main business visualisation artifacts, namely, analysis, reporting, scorecarding, and dashboarding

Business Context for Visualisations
Visualisations need context to turn data into useful information and decisions that can be used to impact your company positively. In this activity, we'll focus on the business context for your visuals.

Advanced Visualisations
We'll be looking at advanced visualisations, what they are and their applications. We'll learn about butterfly charts, stream charts, Marimekko charts, Sankey diagrams, candle-stick charts and more and their applications

The Future of Visualisation
In this activity, we'll go through the expectations for visualisations in the future.

Wrapping Up the Course
This is the closing activity for Week 2, where you reflect on what you have learned during the week and then close out the course.
Prove you're job ready
Highlight the new, job-relevant skills you’ve gained and supplement existing qualifications with a hard-earned, industry-specific digital certificate – plus one for every course within your ExpertTrack.
- Learn the latest in your chosen industry or subject.
- Complete each course and pass assessments.
- Receive certificates validated by the educating organisation.
- Impress employers with learning outcomes you can add to your CV.
- Make your career dreams a reality.
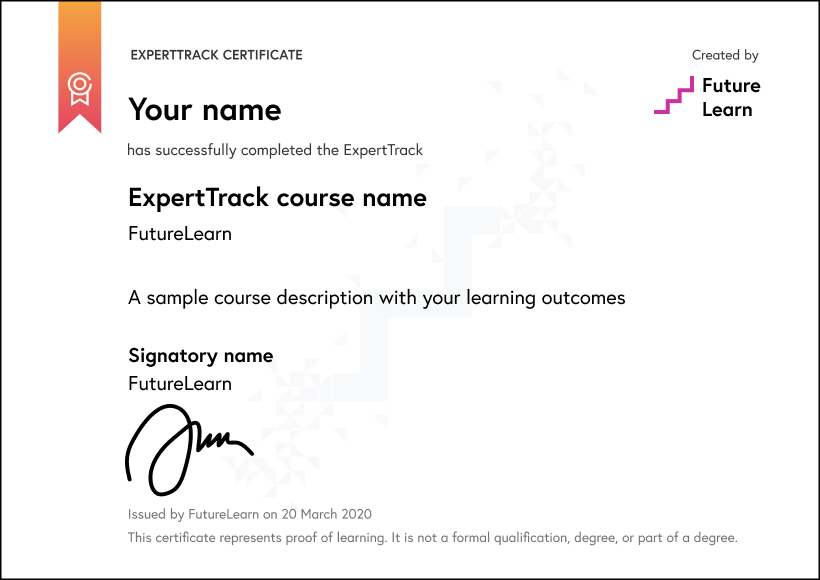
Download a PDF
Who is this accredited by?

This course is accredited by Microsoft
Learning on this course
On every step of the course you can meet other learners, share your ideas and join in with active discussions in the comments.
What will you achieve?
By the end of the course, you‘ll be able to...
- Apply how to build the most-used and simplest data visualizations and chart types
- Describe the understanding of interaction, design, and the science of visualization enhances basic data visualization artifacts
- Perform basic reports and dashboards for applications in work and life
- Identify how to avoid common pitfalls, and make visualizations that work
Who is the course for?
This course is for beginners who would like to improve their data visualisations and their understanding of design. It requires basic Excel skills and beginner-level statistics in order to complete some of the exercises.
What software or tools do you need?
The upgrade version of this course will include all the required CloudSwyft Hands-On Lab practice environments to be used by students and learners on this course, powered by CloudSwyft.
You will need a computer running Windows, Mac OSX or Linux, and a web browser.
Who developed the course?

CloudSwyft Global Systems, Inc.
CloudSwyft has partnered with the top global technology companies to deliver cutting edge digital skills learning across the modern workplace.

Start learning today - free 7-day trial
After your free trial you can:
- Pay $39 per month to keep learning online
- Have complete control over your subscription; you can cancel any time
- Work at your own pace and set your own deadlines at every stage
- Only pay while you’re learning; the subscription will cancel automatically when you finish
- Complete online assessments to test your knowledge and prove your skills
- Earn digital course certificates and a final award that you can share online, with potential employers, and your professional network
- Keep access to the content of courses you complete even after your subscription ends
Learning on FutureLearn
Your learning, your rules
- Courses are split into weeks, activities, and steps to help you keep track of your learning
- Learn through a mix of bite-sized videos, long- and short-form articles, audio, and practical activities
- Stay motivated by using the Progress page to keep track of your step completion and assessment scores
Join a global classroom
- Experience the power of social learning, and get inspired by an international network of learners
- Share ideas with your peers and course educators on every step of the course
- Join the conversation by reading, @ing, liking, bookmarking, and replying to comments from others
Map your progress
- As you work through the course, use notifications and the Progress page to guide your learning
- Whenever you’re ready, mark each step as complete, you’re in control
- Complete 90% of course steps and all of the assessments to earn your certificate
Want to know more about learning on FutureLearn? Using FutureLearn
Learner reviews
Learner reviews cannot be loaded due to your cookie settings. Please and refresh the page to view this content.


