
Data Analytics Project: What Is the Process?
The graphic below outlines the typical stages of a data analytics project.
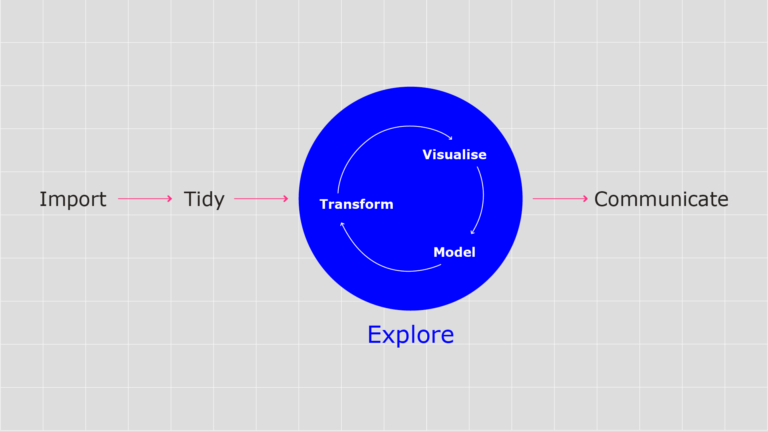
Image adapted from Grolemund & Wickham, p 3 [1]
This model describes the steps an analyst follows, regardless of the technology used to conduct the analysis. Before you begin an analytics project, you should define your requirements and identify your data sources. We’ll look at this in more detail later. Right now, let’s focus on the steps in an analytics project.
Step 1: Importing and tidying data
Your first step is to import data. Data comes in different formats, and the import process you select depends on the tools you use.
You usually need to tidy the data before you can really start working with it. There’s a good chance your initial data will be a large, inconsistent collection of information, riddled with typos, duplicates, bad delimiters, and mis-matched formats. The tidying process involves separating data consistently, so each column represents a single variable in a consistent format, and each row represents a unique observation.
Common tasks include:
- ensuring date values have the same format
- ensuring keywords, tags, or other enumerated data types are consistent
- marking missing or incorrect values
- merging or splitting columns
- filtering or removing unwanted or unnecessary information.
Traditionally, and for relatively small and simple data sets, this is a manual process. For large volumes of data, or if you have more complex requirements, you can use programming solutions.
Step 2: Exploratory data analysis
When you’ve prepared your data, look at it carefully to understand what you’re working with. Exploratory data analysis (EDA) is an iterative process and it can take several cycles to reach the desired outcome.
There are three components in the exploratory stage.
- Transforming your data can involve sorting or filtering data for specific information (e.g. all people in one country, all sales between specific dates), calculating new variables (e.g. an object’s speed using distance and time readings) or calculating summary statistics (e.g. mean value, total count).
- Visualising your data can reveal patterns and help you gain further insights. Visualisations at this stage are often simple, comprising plotting raw data (e.g. histograms), simple statistics (e.g. mean plots or standard deviation), or positioning plots in a way that helps your natural pattern-recognition abilities (e.g. overlaying / separating data, or adjusting the scale of an axis).
- Modelling involves applying techniques or methods to find relationships between variables. The aim is to understand how variables influence the overall system.
Step 3: Communication
Finally, it doesn’t matter how great your analysis is unless you can explain it to others. You need to communicate your results. Your approach will vary depending on who you are communicating with. Decision-makers in your organisation probably want to focus on your conclusions, whereas other analysts will be more interested in how you reached them (they want to know about your model and process).
Now that you’ve explored the stages of an analytics project, ask yourself the following questions.
- Why do you think exploratory data analysis is an iterative process?
- Why might you need to undertake several rounds of exploration to find insights?
References
- Grolemund G, Wickham H. R for data science [Internet]. Available from: https://r4ds.had.co.nz/explore-intro.html
Data Analysis and Fundamental Statistics


Reach your personal and professional goals
Unlock access to hundreds of expert online courses and degrees from top universities and educators to gain accredited qualifications and professional CV-building certificates.
Join over 18 million learners to launch, switch or build upon your career, all at your own pace, across a wide range of topic areas.


