
Objectives and Cost-Benefit Analysis of Customer Service
To measure and monitor the service delivered to customers, there are three main aspects of the ‘perfect order’: these are ‘on-time’, ‘in-full’ and ‘error-free’.
To calculate the service level, each aspects is calculated in percentage, and then the aggregated perfect order achievement is determined by the following equation:
Perfect order achievement = (on-time)% x (in-full)% x (error-free)%
Then, the objective is set for each element and for the aggregated measure.
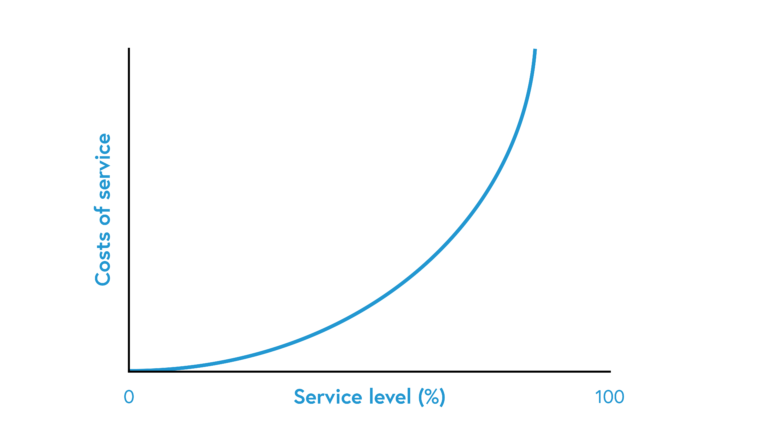
Providing services imposes an extra logistics cost; however, it is vital to deliver proper services to customers. The following image shows that by increasing the service level, the cost of service level increases in a steeply rising curve.
On the issue of finances, the Pareto law (otherwise known as the 80/20 rule) is often cited within a business context. As a general principle, 80% of a business’s revenue comes from only 20% of customers – and 80% of total costs derive from 20% of customers (but unlikely to be the same 20%). This principle will give us a basis for developing an effective service strategy, as well as giving a baseline for prioritising.
Service levels based on a normal distribution
Let’s use a scenario where customer demands are not deterministic and may change based on a normal distribution (or bell curve) shape. If you’re not familiar with what a normal distribution is, or need a refresher, this simple guide is a useful aid for understanding the graph and calculations to follow.
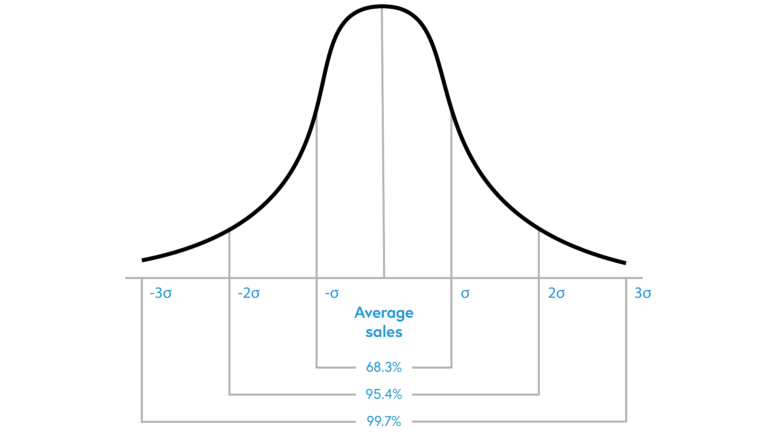
In an inventory and sales case, suppose that customers’ demands can be covered in the range of (x̄-3σ, x̄+3σ), where x̄ is the average demand and σ is the standard deviation of demand – this means that we have a 99.7% service level. In other words, only 0.3% of customer demands will be lost.
However, if we can cover only demands between the range of (x̄-2σ, x̄+2σ) because of available inventory, it means that only 95.4% of demands will be satisfied, so the service level is 95.4%.
Finally, we can cover about 68% of customer demands if the inventory level is determined based on the (x̄-σ, x̄+σ); the reason being that 68% of distribution will be inside the mentioned limitation.
References
Christopher, M. (2016), Logistics and supply chain management (5th ed.). Pearson.
International Logistics: A Beginner’s Guide to Logistics Management


International Logistics: A Beginner’s Guide to Logistics Management
Reach your personal and professional goals
Unlock access to hundreds of expert online courses and degrees from top universities and educators to gain accredited qualifications and professional CV-building certificates.
Join over 18 million learners to launch, switch or build upon your career, all at your own pace, across a wide range of topic areas.


