
Phylogenetic trees

Phylogenetic trees are depictions of the estimated evolutionary relationships between taxa – these can be organisms, species, strains or even genes.
Phylogenetic trees can be used to define relationships between strains of bacteria. In an outbreak, this can identify very closely related strains and reveal which bacterial strains have been transmitted to whom. The taxa are on the tips of the trees, and the internal nodes of the tree represent their hypothetical ancestors. Nodes and taxa are connected by branches. Groups of taxa that share a unique common ancestor are considered a clade.
How are the relationships calculated?
Phylogenetic trees based on DNA sequence are typically built using SNPs (single-nucleotide polymorphisms). The simplest methods are based solely on the number of SNPs between different strains. However, there are more complex methods such as maximum likelihood, which gives the most likely tree that explains the SNP changes shown, given a specific model of evolution. Evolutionary models incorporate information such as the frequency of different SNP changes (for example, the DNA base change A to G is more common than A to C), and the rate of evolution.
A phylogenetic tree is an estimate of the relationships between taxa, and can be different depending on the method or evolutionary model used. Phylogenies can also be greatly influenced by the choice of information to include. To determine how confident we should be in the relationships between taxa, we can use a statistical procedure called bootstrapping. This is where multiple (usually 100s or 1000s) alternative trees are generated, and each node of the tree is given a value based on the proportion of alternative trees that support it. A value of 1 means that all the bootstraps support this part of the tree. A value of 0.5 means that only 50% the bootstraps support it.
Different types of tree
The most common way to display a tree is as a phylogram (see Figure A and B), where the branch lengths are variable, and represent the evolutionary distance between the nodes.
For trees displayed in a rectangular fashion (as in Figure A), evolutionary distances are represented by horizontal branches. One can work out the inferred evolutionary distance between two taxa by adding up all the horizontal branch lengths that join them. The order and length of the vertical branches does not mean anything – these are just organised to make the tree readable. Trees can also be shown in a radial or star fashion (Figure B), where all of the branches correspond to evolutionary distances. Figure A shows a rooted rectangular tree, where the position of the inferred common ancestor of all the bacteria is known. To make a rooted tree, researchers usually include an extra, distantly-related strain as an outgroup. In an outbreak, a rooted tree can be useful as it enables us to determine the order of infections in a transmission chain. However, for bacterial studies an unrooted tree, with no extra outgroup strain, is often sufficient (Figure B). It is important to remember that phylogenetic trees that look very different can actually show the same information, as our two examples below do.
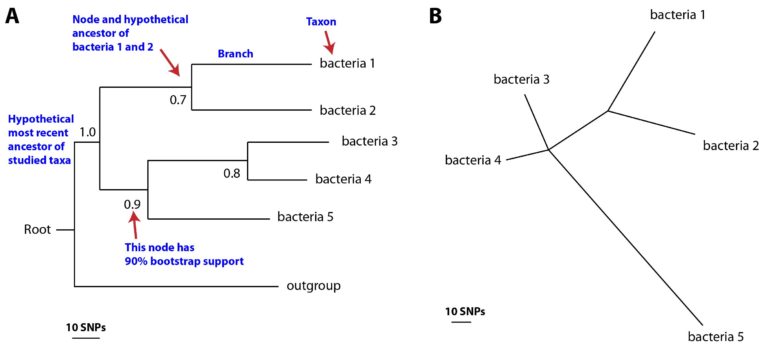
Figure (A) rooted and (B) unrooted phylogenetic trees, with key features shown. (Click image to expand)
Now look at the trees in Figure A and B in more detail. As we know, they both show the same information, but tree A is rooted by adding a distantly related strain. The node separating bacterial strains 1 and 2 from strains 3, 4 and 5 is the most confident relationship in the tree with 100% bootstrap support. The most closely related two strains are bacteria 3 and bacteria 4, as shown by branch length in both the horizontal tree (A) and the radial tree (B). The least confident relationship in the tree is bacteria 1 and bacteria 2, which has 70% bootstrap support. This means that the closest relative of each of these bacteria might actually be a different isolate, elsewhere in the tree. Including more bacteria in the phylogeny would make these relationships clearer – this is why bacterial phylogenies in research often include hundreds or even thousands of strains.
Bacterial Genomes: Disease Outbreaks and Antimicrobial Resistance


Bacterial Genomes: Disease Outbreaks and Antimicrobial Resistance
Reach your personal and professional goals
Unlock access to hundreds of expert online courses and degrees from top universities and educators to gain accredited qualifications and professional CV-building certificates.
Join over 18 million learners to launch, switch or build upon your career, all at your own pace, across a wide range of topic areas.


