How much moisture is produced indoors?
Moisture is naturally present in the air and in most materials in the home. However, excess moisture affecting indoors can be generated during construction and occupation as you can see below:
Moisture generated during construction
Construction activities, such as concreting, laying screed floors, bricklaying, plastering, and painting, introduce substantial water into a building site. The amount of water added can vary depending on the home’s design and may reach up to 8000 litres, equivalent to roughly 800 full buckets. While the construction moisture will eventually evaporate and escape into the outdoor air, it can also contribute to the moisture levels inside a newly built home. Moreover, rainwater may seep into parts of the structure before the roof and walls are completed, further increasing the moisture content that needs to be dried out.
In practice, this early moisture load combines with normal household activity, which can make new homes particularly prone to condensation and mould during their first winter.
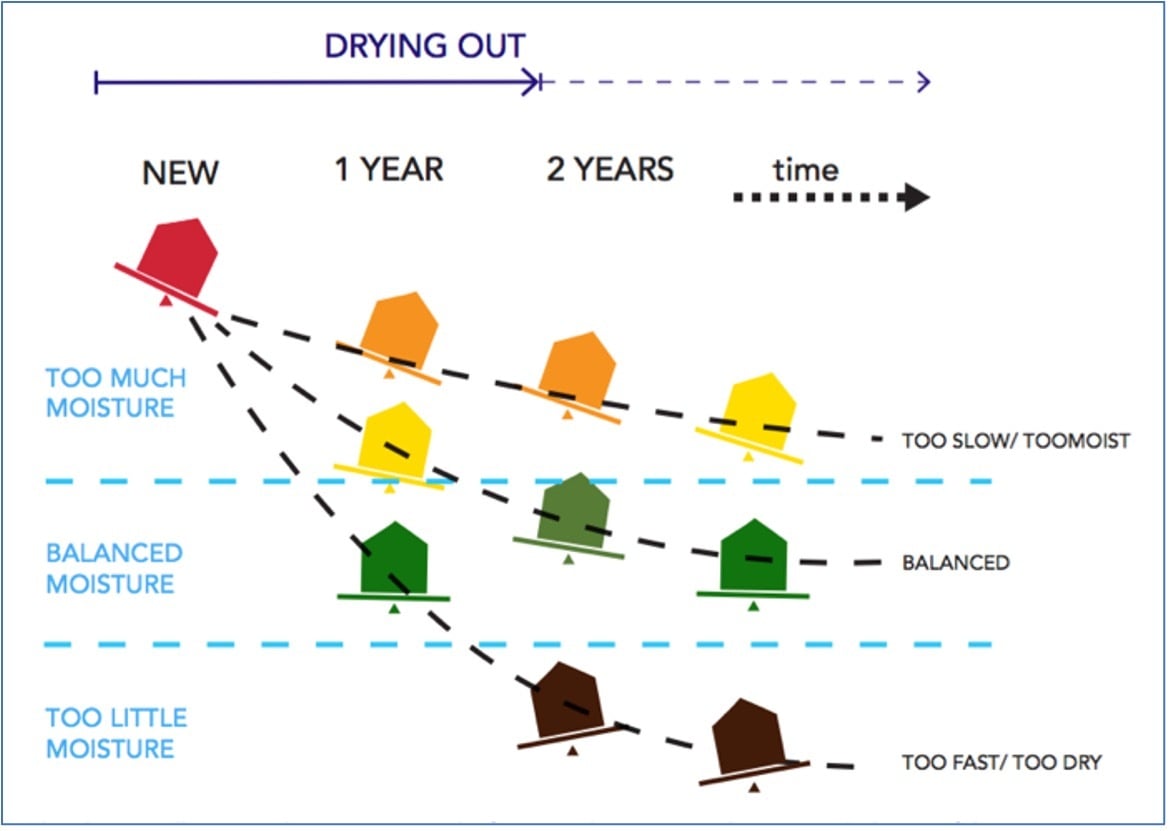 The diagram illustrates the drying process over time, emphasising the importance of maintaining balanced moisture levels. Initially, materials may have too much moisture, leading to issues like mould or decay. As time progresses, the moisture levels ideally become balanced, representing the optimal state. However, if the drying process is too slow, the material remains too moist, while if it is too fast, the material becomes too dry and brittle. Diagram adapted from Moisture in new homes a guide for occupants
The typical drying time after construction is 1-2 years. However, this is subject to many variables, such as:
- Construction method, e.g. traditional masonry or timber framed
- Finishes, e.g. wet plaster or dry plasterboard lining
- Climate, e.g. dry/windy or humid
- Weather, e.g. dry and sunny or wet and windy
- Heating (more heating will dry the house out faster)
- Ventilation (good ventilation allows moisture to escape more quickly)
Due to the moisture generated during construction, most homes begin their lives in a state of moisture imbalance. Therefore, some moisture-related issues are expected, and they should be correctly addressed.
Be aware that vapour barriers, high-resistance underlays (in roofs), and high-resistance AVCLs can slow down drying. AVCLs (Air and Vapour Control Layers) are membranes designed to reduce the movement of air and moisture through building elements. For more information on AVCLs, see this Historic England report
Moisture generated during occupation
Our daily home activities add significant amounts of moisture to our living spaces. Factors like household size, lifestyle, and the use of household appliances all impact the amount of moisture generated. Homes that produce more moisture will be closer to their moisture capacity. Therefore, it is essential to consider decreasing the moisture generated indoors and pay special attention to enhancing ventilation and using heating systems in cold weather.
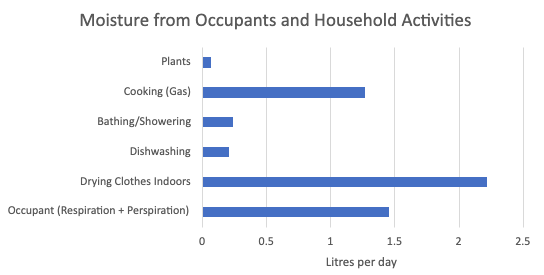
The various household activities significantly vary in moisture generation, as seen in the figure above (values provided by the UKCMB). BRE Digest 297 (1985) indicates that a four-person household generates 5-20 litres of daily moisture. The average moisture generation is 8.5 litres per day.
In the figure below, we provide an example of how different household configurations can generate various moisture levels, according to the primary sources of moisture in a home, expressed in litres per year.
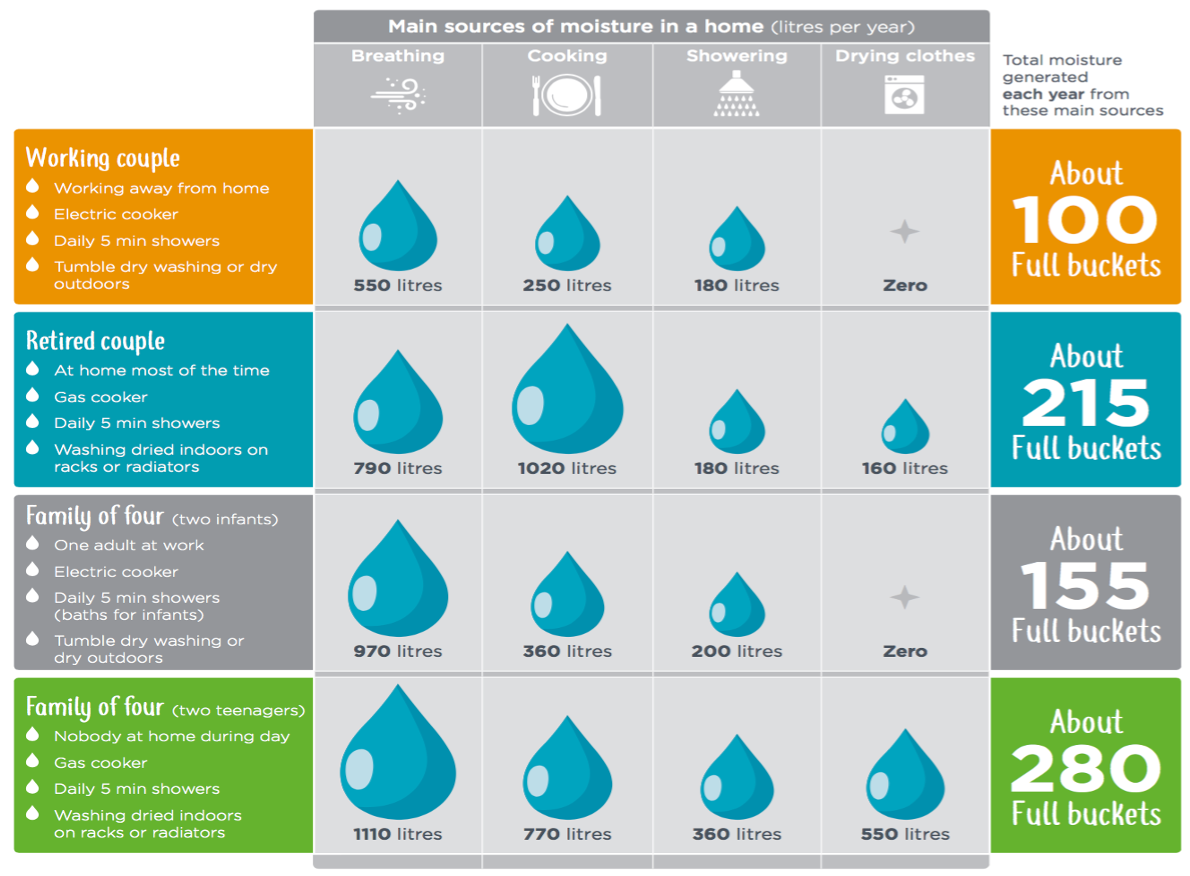 Diagram Source: NHBC Moisture in New Homes: a Guide for Occupants
Moisture-Safe Homes: Understanding and Managing Condensation, Damp, and Mould

Moisture-Safe Homes: Understanding and Managing Condensation, Damp, and Mould