Why does moisture within materials matter more than air humidity?
Understanding the role of moisture is crucial. But what exactly do we mean when we say water is a critical factor in mould and building defects? Mould can grow on nearly any material, but its success largely depends on the moisture available in the substrate, not just the humidity in the air.
This section introduces a slightly more advanced concept: water activity. If you are new to moisture science, the key takeaway is simple: Mould growth depends more on how damp a surface is than on room humidity alone.The technical explanation below supports this principle.
Moisture availability v/s air humidity
Research shows that surface moisture (or water activity) plays a more important role in mould growth than relative humidity (RH) alone. In fact, mould has been observed growing even when air humidity was low, due to favourable water activity (aw) levels within materials [1].
But what is the difference between relative humidity and water activity?
As we saw previously, relative humidity (RH) is the amount of water vapour in the air compared to the maximum it can hold at a given temperature. When RH reaches 100%, the air is saturated, and condensation can occur. This saturation corresponds to a water activity (aw) of 1.0 (pure water).
Water activity, on the other hand, refers to the amount of water available within a material (substrate). It’s defined as: aw = w/wo, where w is the vapour pressure of water in a substrate, and wo is the vapour pressure of pure water at the same temperature. Essentially, Water activity determines how water behaves in a material, influencing mould growth, chemical reactions, and physical properties.
The relationship between water activity and relative humidity is simple: aw = RH / 100. For instance, an aw of 0.75 corresponds to 75% relative humidity. This connection helps us predict and control moisture-related issues in buildings.
The image below shows a horizontal bar chart linking RH (top) and aw (bottom), ranging from 10% to 100% RH (0.1 to 1.0 aw), with colour-coded increments of 10%.
<img src="https://ugc.futurelearn.com/uploads/assets/8c/bd/8cbd60c4-a00b-4a0a-9017-fedabb9a75cc.png" alt="The image is a colour-coded chart showing the relationship between relative humidity (RH) and water activity (aw). The image displays a horizontal bar graph. The top of the graph is labelled "RH". Numbers representing percentages of relative humidity (RH) from 10% to 100% are shown above the bar, equally spaced. Below the bar, the label "aw" is shown in bold black, with numbers representing water activity values from 0.1 to 1.0 placed below corresponding RH percentages. The bar itself is divided into colour-coded segments representing different ranges of RH and corresponding aw. The segments maintain a consistent width for corresponding 10% RH increments along the bar.”>
Controlling humidity and water activity for mould growth prevention
Managing both RH and aw is essential for mould control. The importance of this relationship is recognised in building regulations. For instance, the Approved Document F 2021 of the Building Regulations for England and Wales outlines specific RH and air thresholds to help prevent mould growth, as shown below.
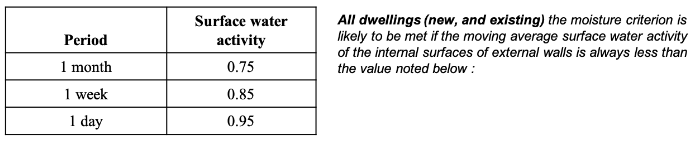
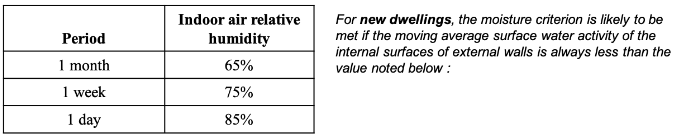
These criteria effectively set limits for how long internal surfaces can remain damp. For example, maintaining surface aw below 0.75 for a month, or RH below 65 %, should prevent fungal growth even in cool periods. The values highlight that short spikes in humidity are less critical than sustained high moisture conditions, reinforcing the need for continuous background ventilation and even heat distribution.
In summary, it is the moisture content of materials, rather than air humidity alone, that ultimately governs whether mould and decay can develop. Assessing both material moisture and indoor air conditions gives a far more reliable understanding of moisture risk in buildings.
Reference
1. Pasanen A. L., Kalliokoski P., Pasanen P., Jantunen M.J. and Nevalainen A. (1991) Laboratory studies on the relationship between fungal growth and atmospheric temperature and humidity. Environment International, 17, pp. 225-228.
Moisture-Safe Homes: Understanding and Managing Condensation, Damp, and Mould

Moisture-Safe Homes: Understanding and Managing Condensation, Damp, and Mould