
Data analytics types and amplified intelligence
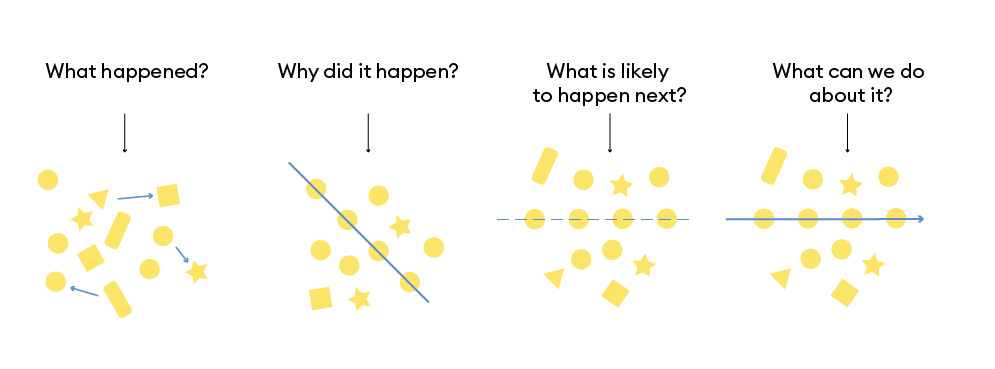
Interestingly, the progression of the four business focused questions we discussed in the previous section — “What happened?”, “Why did it happen?”, “What is likely to happen next?”, and “What are some of the things we can do as a result?” — is the same as the progression of the four key types of data analytics. Here’s how…
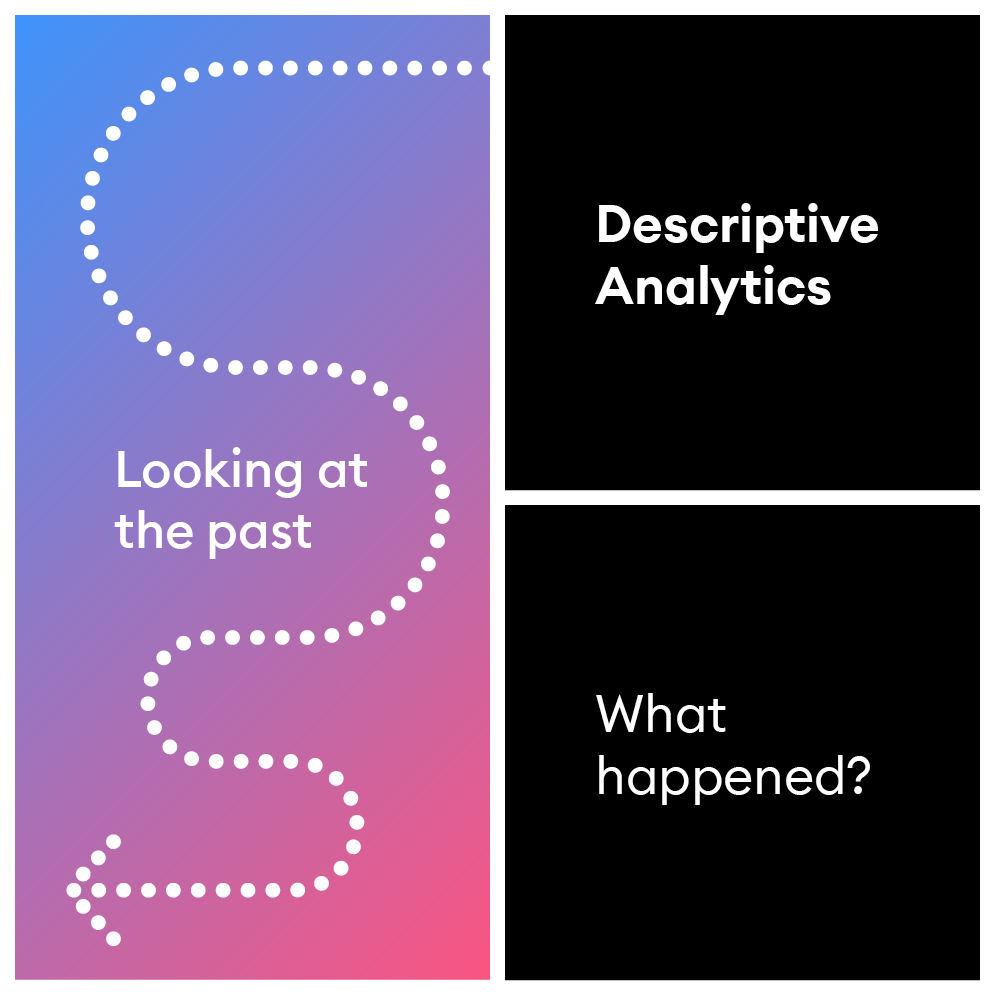
The first of these is descriptive analytics
Descriptive analytics delivers insights to answer the question “What has happened?”. It does this by gathering, processing, and summarizing historical data in order to collect useful information and prepare it for further analysis.
A lot of this historical data is produced internally by the organization. The data comes from different departments, such as finance, marketing, distribution, warehousing, etc. We can also run descriptive reports on external data, which is data that has come from any source outside the organization. Common examples of where external data can be found include weather reports, a population census, national or federal holidays, geolocation, social media posts, etc.
Descriptive analytics helps reveal patterns and meaning through the comparison of historical data-sets. Insights are not used for making inferences or predictions, which means that we’re unable to answer the questions of ”Why did this happen?” or “What is going to happen next?” Think of it like a history book that only tells you names, dates and what happened, but doesn’t tell you why these events happened.
What descriptive analytics can do is enable organizations to measure performance to ensure goals and targets are being met. If they aren’t being met, descriptive analytics can identify areas that require improvement or change.
Here are some specific examples of how descriptive analytics can be used:
- A profit and loss account
- A balance sheet
- Summarizing past events such as sales, operations data, or marketing campaigns
- Social media usage and engagement data
- Inventory analysis
- Reporting general trends across different locations, e.g. sales increased in Europe but declined in Asia over the same period
- Collating survey results
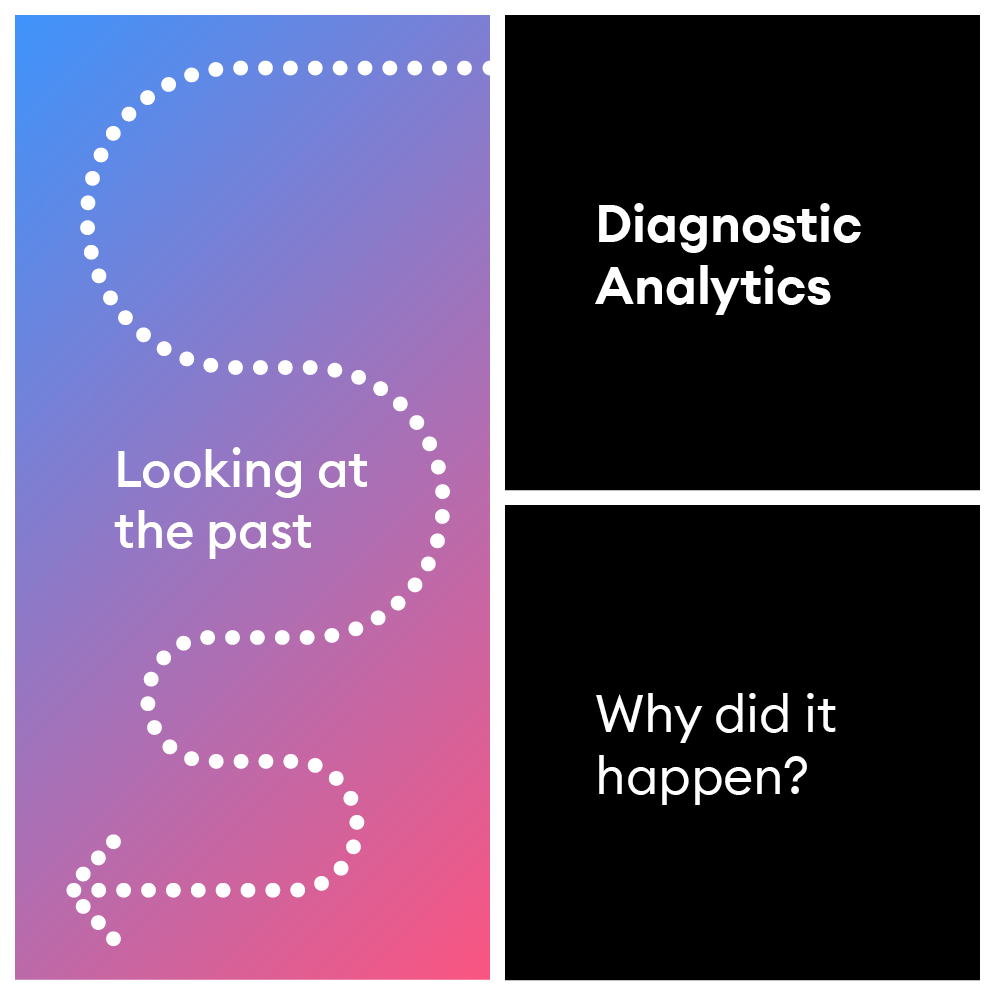
The second is diagnostic analytics
Diagnostic analytics describes the techniques you’ll use to answer: “Why did this happen?” It’s a deep-dive into your data to search for valuable insights to identify the root causes of a situation.
Diagnostic analytics adds further context to descriptive analytics by seeking correlations between different data-sets and sets of results. In other words, they’re used to measure or explore the extent to which different things are related to each other, and what effect changing one would have on the other.
Adding this further context requires the data analytics infrastructure to process a lot more data and perform more complex computations than at the descriptive analytics stage. Thanks to the ability for us to capture, clean and transform data using the data analytics infrastructure, and being able to increase the processing power using machines, we’re able to provide quicker, more accurate results to answer the question: “Why did this happen?”
So the difference between the first two types of data analytics is that descriptive analytics is the initial step of data analysis that chronicles the facts of what has already happened. Diagnostic analytics goes a step further to uncover the reasoning behind why it happened enabling leaders to make better-informed decisions.
Just as we’ve touched on what diagnostic analytics is, it’s useful to also discuss what it is not…
What diagnostic analytics is not
Diagnostic analytics is not a plug and play, automated technology solution. Diagnostic analytics allows us to use historical data in order to find the root cause of why something happened. What it cannot do, without human input, is determine the areas of focus and then make any decisions based upon the results of those answers.
For example, if you need thousands of complex calculations done or want to find correlations in an enormous data set, the human mind simply isn’t going to be able to do that.
But, if you try to use computers and algorithms to make complex decisions, understand empathy, solve problems or collaborate, then you will not find much success at all. Those are human-centric tasks that machines can’t match.
The human factor is key to ensuring diagnostic analytics results:
- Are first targeted
- Are then actionable and result in useful and strategic actions that will take the organization forward
Human understanding, reasoning, problem solving, and decision-making capabilities may allow for speculation around a question like “What might happen?” from these findings.
Diagnostic analytics will not confirm any speculations about the future. Diagnostic analytics also doesn’t provide us with the data-sets that answer questions we may have about the future. We need predictive and prescriptive analytics in order to model likely outcomes with some degree of accuracy.
The third is predictive analytics
Predictive analytics looks into the future to answer the question: “What is likely to happen next?”
To forecast what might happen in the future, predictive analytics uses statistical modeling and Machine Learning (ML) to find patterns and reliably project trends and behaviors.
Just like the first two types of data analytics, predictive analytics can also require a business to look at both internal and external data-sets.

Until recently, predictive analytics was used in industries such as insurance, investment banking, healthcare, and commodity brokering, all of which could more easily gain a return on investment (ROI). As these industries produced a lot of data that was central to their business model, they’ve always been more likely to invest large amounts in their data analytics knowing that it will pay off.
Only recently has an undeniably strong case been made for wider adoption of predictive analytics by organizations outside these industries. This is because more and more organizations are now able to benefit from predictive analytics as technology brings more stable and affordable solutions.
The ability to collect data from all aspects of the business and beyond has resulted in growing volumes of data. Coupled with the increased computing power that’s now available to everyone, and the advent of cloud computing, it has created the perfect environment for predictive analytics.
What predictive analytics is not
Data analytics, in particular predictive analytics, has an enormous impact on some parts of your business, but it isn’t true that it can help all aspects of your business. Even with huge budgets and massive datasets, predictive analytics isn’t the solution to every problem.
It’s important to understand where predictive analytics can help your organization and where it will be less effective. Predictive analytics can’t get rid of all uncertainty, and in highly changeable situations where you have no control over the variables, the sheer number of possible outcomes makes it impossible to forecast accurately.
Predictive analytics heavily relies on algorithms. These are essentially a set of rules, problem-solving operations, and mathematical calculations to solve pre-identified problems. But, as with all types of analytics, it requires human input before it can even begin its work, because it’s humans that need to identify all the variables they feel will have an impact on the outcome of the project.
The goal with predictive analytics is to go beyond just knowing what has happened to instead providing the best assessment of what will likely happen in the future. However, even the most advanced predictive analytics models are unable to predict complex problem sets such as the global effects of a pandemic in which every city, district and country will make different, unpredictable decisions.
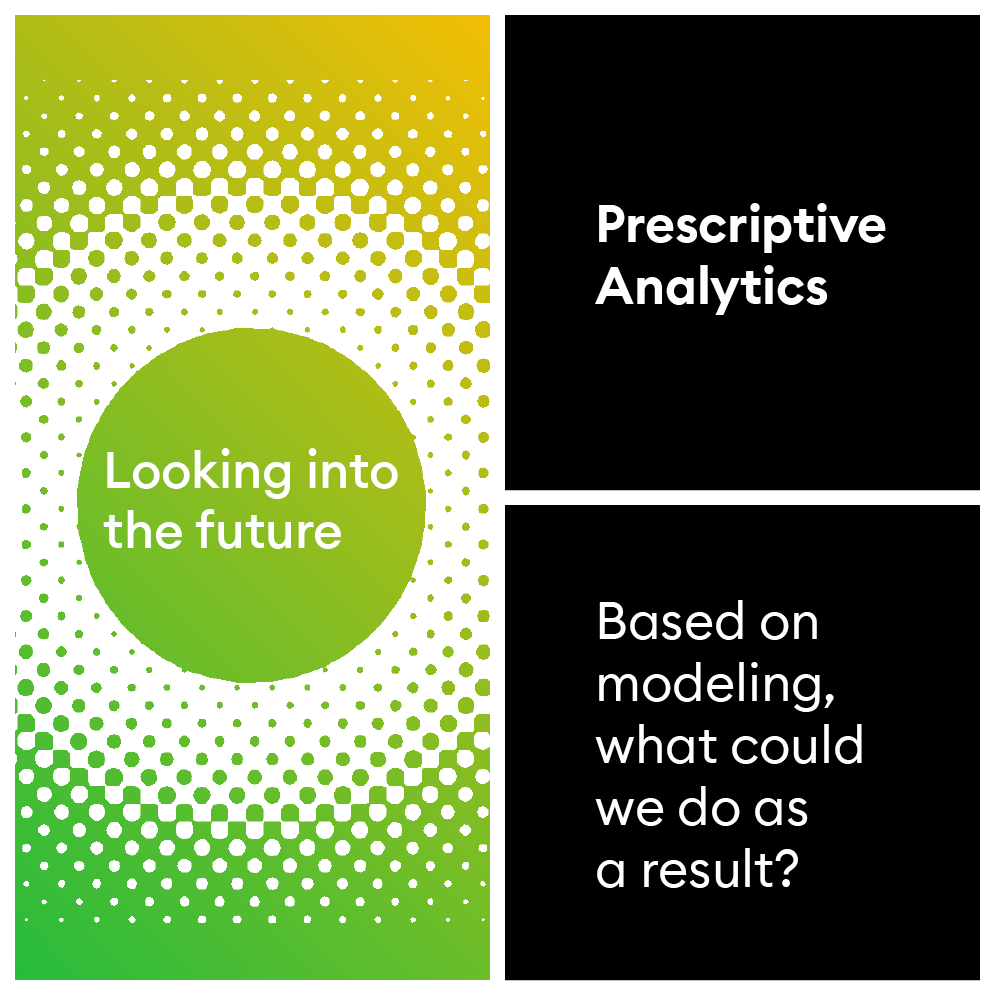
The fourth is prescriptive analytics
Prescriptive analytics answers the question: “What are some of the things we can do as a result?” It takes the results of predictive analytics and forecasts different possible outcomes for an organization to either course-correct, or it can provide actionable suggestions for how best to reach their strategic goals.
This is an immense job, requiring a large amount of data from different sources and the ability to model and assess risks for a lot of different scenarios. Using AI and statistical modeling, prescriptive analytics creates and recreates the effect that millions of different decisions might have on the organization and how the outcomes might change.
As with predictive analytics, prescriptive analytics had previously only been affordable for a few select industries. But advances in cloud computing, data speeds and new data services means it’s becoming possible for other organizations to invest in prescriptive analytics.
Big ideas such as self-driving cars and calculating insurance premiums get the most attention and featured articles; however, prescriptive analytics no longer needs to be reserved for grand strategic decision-making or major product innovation. Once set up, prescriptive analytics can be used to make smaller, specific decisions in everyday situations. For example:
- Setting production and inventory levels to meet forecasted demand at sales locations
- Eliminating unnecessary driving, flight, and sea transportation miles
- Decreasing transaction processing time, lowering transaction costs or increasing the total amount of possible transactions processed in a particular time period
- Optimizing the selection and pricing of products in a retail store
Whether prescriptive analytics is used to help map out the future strategic direction of the organization, or help solve everyday occurrences, the important element to remember is that prescriptive analytics is able to work through vast amounts of data in order to model future probabilities and provide actionable suggestions together with forecasted outcomes.
One element that all prescriptive analytics projects have is the quest for optimization. To achieve that, you’ll need to take into account as many factors as you can. Prescriptive analytics relies on big data collection because every factor that could be relevant needs to be included.
All of the data an organization gathers can be used for prescriptive analysis, whether it’s structured (clearly defined and searchable types of data, e.g. text and numbers) or unstructured (stored in its native format, e.g. audio, video, and imagery).
So that’s an overview of what prescriptive analytics is. Now let’s find out what it isn’t…
What prescriptive analytics is not
Prescriptive analytics isn’t a crystal ball. With any speculation there are risks and there’s uncertainty. While prescriptive analytics minimizes risk(s) and works to understand possible outcomes through looking at a broad field, you’ll never eliminate uncertainty, or be able to account for all possible factors. Intuition and experience are still important factors in prescriptive analytics for both the data and business teams.
Prescriptive analytics isn’t going to eliminate all bias. Because prescriptive analytics relies on humans to drive decisions and variables, there’s a danger that outcomes may contain an element of bias and be used to substantiate a predetermined path, even if it’s at the subconscious level. We need to remember that prescriptive analytics is at best a guide and a tool to help us reduce risk and make better informed decisions. The possibility of elements such as bias or unpredictable events occurring mean we can’t expect prescriptive analytics to produce the definitive answers we may be seeking.
Prescriptive analytics isn’t going to remove all decision-making. Prescriptive analytics can lay a set of actions and the likely consequences of those actions in front of us, but it’s up to decision-makers to determine which course of action they’re going to take, given the information provided. It’s up to the people utilizing the outcomes of prescriptive analytics to decide which of the suggested routes is best.
Prescriptive analytics is not a linear process. We’ve taken you through the different types of data analytics to show you its building blocks and demonstrate the importance of structuring and organizing data for useful and accurate results. However, it’s important to remember that prescriptive analytics, and data analytics in general, is not a linear process.
Organizations don’t necessarily need to go through each stage (descriptive to diagnostic to predictive to prescriptive) in order to explore a hypothesis or understand the root cause of something. However, it’s important that the data analytics infrastructure is set up in a way that allows each of these stages to happen and be explored.
For example, you don’t always need a descriptive analytics report to feed into the Machine Learning algorithms and statistical modeling programs before setting off on a prescriptive analytics exploration. But the system still needs to be set up to gather results of what has happened historically, even if this isn’t a named or purposeful step. This allows the algorithms to discover meaning and correlations, learn from past experience, and develop the weighted decision paths required by the AI.
All this means is that the required processes for a prescriptive analytics project will depend on your starting point and approach.
The data teams will understand the process. However, as we’ve discussed, a data strategy is a business strategy so it’s important that the business teams understand the process and are engaged, certainly in the beginning and end stages. As with all data analytics, when leaders embrace prescriptive analytics, they must engage with both the business teams and the data teams through collaboration and communication to ensure that they have the right skills to manage the change that comes with its adoption.
Present
We’ve explored the past, looking at descriptive and diagnostic analytics, and looked at the future with predictive and prescriptive analytics, but what about the present?
The data analytics infrastructure, processes and applications are very good at allowing us to explore our data and make sense of it. However, organizations deal with a lot of information, so they need to have a mechanism for capturing the answers to these questions and organizing them for use on a daily basis.
Ultimately, when we’re looking at the past (descriptive and diagnostic analytics) or toward the future (predictive and prescriptive analytics), we’re doing so in order to improve our daily operations and our future planning today. That means that data analytics is as much about today as it is about the past and the future. It allows us to be proactive versus merely reactive.
Data analytics is used to research and inform all sorts of problems, not just business focused ones. For example, data analytics and quantum computing are driving research into new pharmaceuticals and health cures. Sports such as Formula 1 are using data analytics to improve the safety, efficiency and performance of their cars, and the analysis of huge amounts of data are helping us fight climate change through increasing energy efficiency and waste reduction.
When we talk about data analytics helping businesses today, we need to ensure we’re combining our data analytics tools and our business intelligence (BI) tools to research business focused questions and objectives.
Essentially, BI is the tools, technologies, applications and processes of analyzing and reporting current and historical business data. BI is used to help optimize business operations, focusing on organizational goals.
BI tools and processes display data analysis as clear, actionable insights by presenting comprehensive and accessible business metrics that can support better day-to-day decision-making. The findings from BI can be shown in dashboards, reports and data visualizations to help members of the organization and relevant stakeholders understand, digest and manipulate information that comes from the data analytics processes.
We can use these insights to aid in our decision-making, but as with every aspect of data analytics, BI isn’t going to do the work for us. We must make the choice to act upon what we’re being told. Tools are only as good as the people using them, after all.
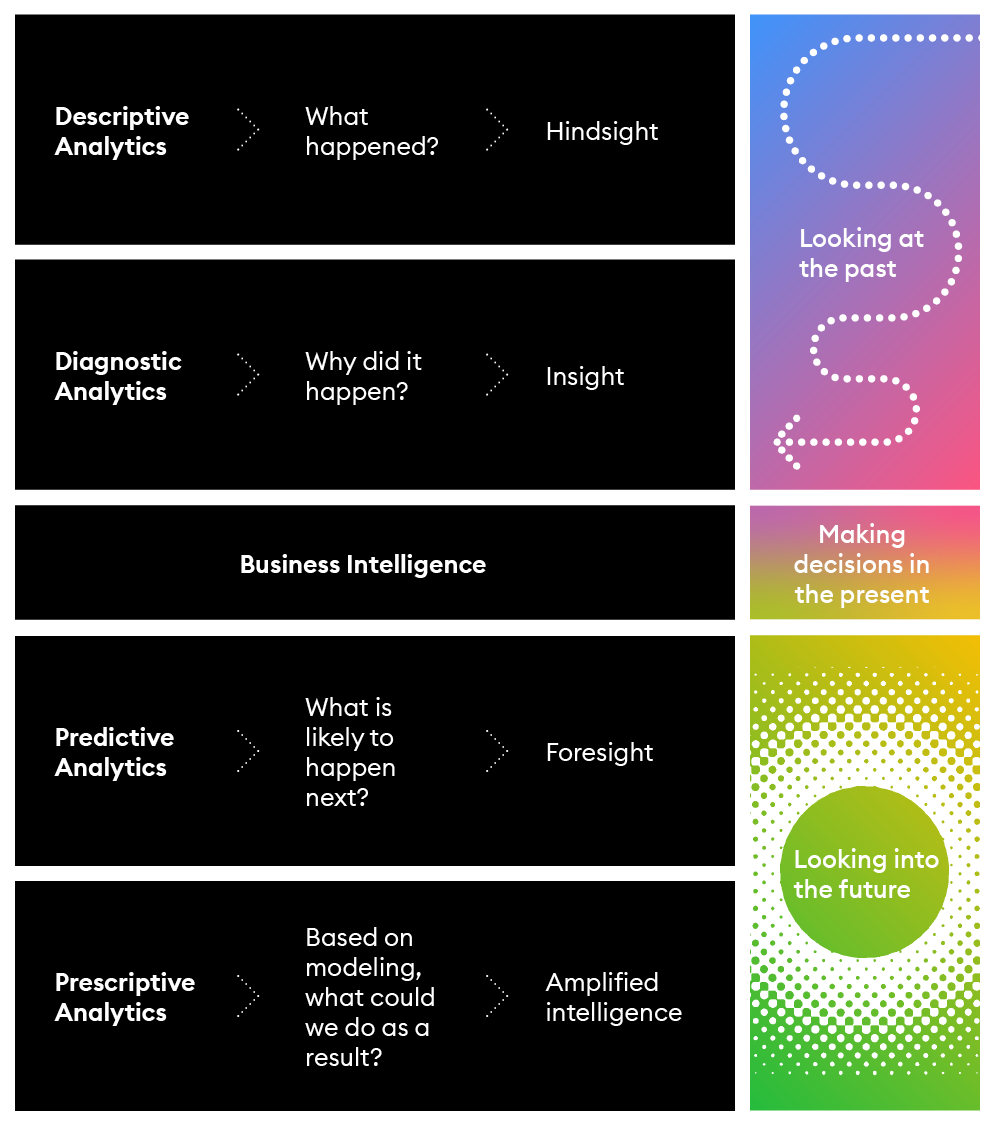
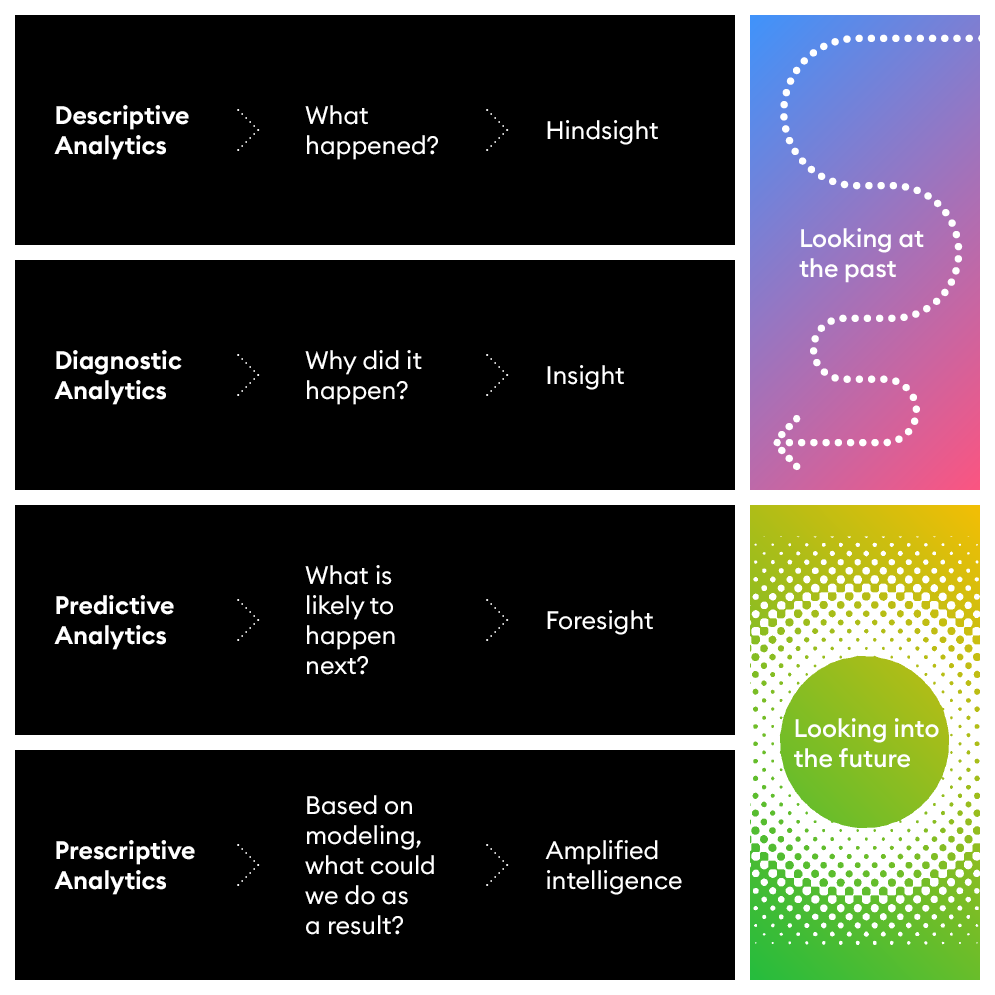
Before we move on, here’s a quick reminder of what question each type of data analytics answers and how:
- Descriptive analytics uses historical data to tell us “What happened?”
- Diagnostic analytics uncovers the reasoning and root causes behind what happened. It tells us “Why did this happen?” by identifying correlations in our data.
- Predictive analytics relies on statistical modeling to forecast “What might happen next?” by taking historical data and projecting forward to make predictions.
- Prescriptive analytics uses these same forecasts and predictions to suggest a course of action. It tells us “What can we do next?” and aids in our decision-making.
We use and apply data analytics principles and techniques to answer these business questions in quicker, more accurate ways. By building a data analytics infrastructure and process, we’re able to cut down the discovery time, which then enables us to spot patterns and test hypotheses in ways that a manual approach simply doesn’t allow.
From data to amplified intelligence
We’ve had a look at how the different stages of data analytics relate to the organization and which questions they’re used to answer. Now we’re going to clear our heads of all the extra noise around data and simply look at it in the classic, most basic form. Remember: Data, on its own, doesn’t carry any meaning. Without context, data has no value of its own.
But through data analytics, we can add that context. We can map how data transforms into hindsight, then insight, then foresight, and then amplified intelligence.
As we progress through these transformations, you’ll notice a pattern as the data follows the same progression as the business case questions, and the same progression of the different data analytics types as well.
Hindsight
Data always remains as data, but it provides hindsight when it’s organized and has context added to it. This is the start of the data analytics journey, turning data points into meaningful information. Today we’re able to use technology as a tool to capture and move data in ways that allow us to more readily apply context and then organize that context to create meaningful information.
When technology and tools are applied to help transform data into hindsight, this is referred to as descriptive data. It allows us to answer the question “What happened?”
This is not a new process. However, even a few years ago it would have taken much longer to do than it does now, causing delays in decision-making.
Turning hindsight into insight
Within data analytics, turning hindsight into insight is called diagnostic analytics. It allows us to build upon what happened to understand why it happened through the discovery of connections and correlations.
For diagnostic analytics we’d use wider data-sets from different data sources to identify and learn from correlations. The data analytics infrastructure and processes provide access to up-to-date organized knowledge and, thanks to visualization software and clever data engineers, we’re able to gain quicker access to insights to make proactive decisions.
Turning insight into foresight
One of the things that separates humans from machines is our ability to use insight. It’s here that we shine. Notwithstanding all the hard work, specialist skills and application to get us here, it’s at this point that we’re able to start applying this insight toward our organizational goals and strategy.
Predictive analytics uses a large range of external data-sets and advanced systems and techniques such as statistical analysis and Machine Learning (ML) to model future scenarios. This gives us foresight into what might happen next which allows us to make forward-thinking, strategic decisions backed up by data.
Turning foresight into amplified intelligence
To remain competitive today we need to be ahead of our business rivals and industry trends. Change is the new constant and organizations need to be adaptive if they want to survive and thrive, which requires us to have a good relationship with risk. Understanding what’s likely to happen in the future and seeing the consequences of different actions brings strategic value and helps us manage risk by minimizing uncertainty. This is where we enter the field of prescriptive analytics and gather amplified intelligence.
Amplified intelligence is the next step in an organization’s quest to become data-led; the ability to build upon hindsight, insight, and foresight in order to plan for the future.
To do this, data scientists work with the data analytics managers and business teams, using advanced algorithms.
These algorithms take internal and external data and use Artificial Intelligence (AI) and Machine Learning (ML) in a process called prescriptive analytics to look to the future and provide actionable suggestions as well as likely outcomes of those actions.
This takes a large amount of computing power to work through all the possible variables and outcomes.
Hindsight to insight to foresight to amplified intelligence
We can recognize how, by using the data analytics infrastructure, data progresses as follows:
- Adding context to meaningless information to provide hindsight
- Adding correlations transforms the hindsight into insight
- Using ML and statistical modeling to model future scenarios from our insight(s) to create foresight
- AI uses this hindsight, insight, and foresight to provide actionable suggestions based upon the modeled outcomes, bringing amplified intelligence to the organization
 What happened? > HindsightDiagnostic Analytics > Why did it happen? > Insight Looking into the future:Predictive Analytics > What is likely to happen next? > Foresight Prescriptive Analytics > Based on modeling, what could we do as a result? > Amplified intelligence”>
From collecting data to planning for the future
This progression happens as data goes through the data analytics infrastructure and processes. No matter what stage of data analytics your project might start at, be it descriptive, diagnostic, predictive or prescriptive, data will still need to be transformed and processed so it’s suitable for the stage you’re working on.
It’s worth pointing out that while this linear approach may help you to understand how all the elements of the data analytics ecosystem fit together, it doesn’t necessarily determine where you begin. Determining factors for where you start include the maturity of your data strategy, the resources you have available to drive it, and what makes the most sense for your current business strategy and objectives.
Understanding the different components of the data analytics ecosystem and how they help achieve organizational goals provides the mental tools you’ll need to navigate an increasingly digital workplace, where data analytics and data literacy form the basis of strategic decision-making.
Introduction to Business Intelligence and Data Analytics


Introduction to Business Intelligence and Data Analytics
Reach your personal and professional goals
Unlock access to hundreds of expert online courses and degrees from top universities and educators to gain accredited qualifications and professional CV-building certificates.
Join over 18 million learners to launch, switch or build upon your career, all at your own pace, across a wide range of topic areas.


