Introducing frequency trees
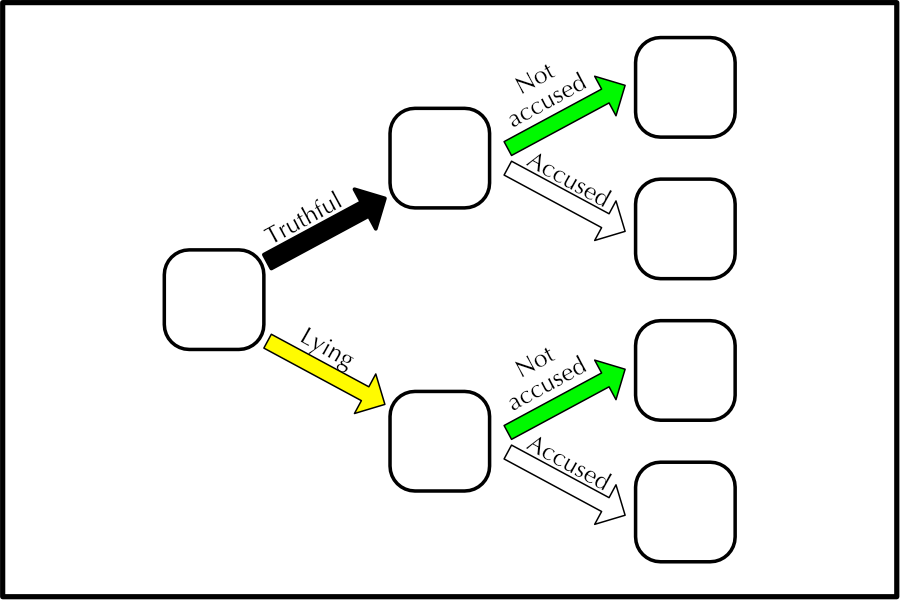
A tree diagram is a good means of recording the expected frequencies for the experiment.
Students may find it useful to record their results on a copy of the tree diagram. As we did in Week 1, you could use the diagram to emphasise the idea of a narrative that develops as we move through the branches; for example:
- What does the top route through the diagram represent? [It shows the situation where a student is telling the truth, and is not accused by the teacher.]
However, the real power of the diagram becomes clear when we use it to record the expected frequencies for the experiment. We usually fill in the diagram using a classroom dialogue that typically goes like this:
Teacher: Let’s forget about the actual results of your experiments for now, and concentrate on what we would expect to happen. Let’s start with the box on the left: how many trials were there altogether?
Students: 24
T: OK, so I will write in 24 here at the start of the tree. Now, how many of these 24 students would you expect to be lying?
S: Four
T: Why?
S: Because the spinner has got one orange part out of six - so you divide by six to see how many people were lying.
T: Good. Now, of those four people who were lying, how many would you expect the teacher to accuse?
S: All of them.
T: Why?
S: Because the teacher accuses all of the people who are lying.
…and so on.
Use the downloadable template to record the rest of the expected frequencies.