
Data Science: How do Neural Networks Work?
A neural network is a set of algorithms that aims to recognise the relationships in a set of data by mimicking the way that the human brain works. The basic idea is to simulate the densely interconnected brain cells in a computer system, such that a program can learn things, recognise patterns and take decisions as a humanlike way.
In reality, the term ‘neural network’ is not new, it has been around since the ’40s when Warren McCullough and Walter Pitts were working in the University of Chicago and proposed the idea of developing artificial intelligence algorithms to mimic the behaviours of the human brain. As expected, neural networks aka Artificial Neural Networks (ANN) are a shared area of research and development in both computer science and neuroscience.
So, what is a neural network?
In its basic form, a neural network is a method for performing machine learning tasks, training a computer with labelled training data. In other words, a computer program can learn to make decisions based on a model it builds from a training dataset. A simple example is a face recognition system that is trained to learn to identify your face using a small training set of photos so that it can correlate it with your test images, identified through your camera, while you try to unlock your smartphone.
This example can be extended to a more generic car recognition system used in central London to identify different motorbikes and different car sizes. It works by using already labelled images that are fed to a system and to identify the class of a vehicle (eg, truck, motorbike, car, etc).
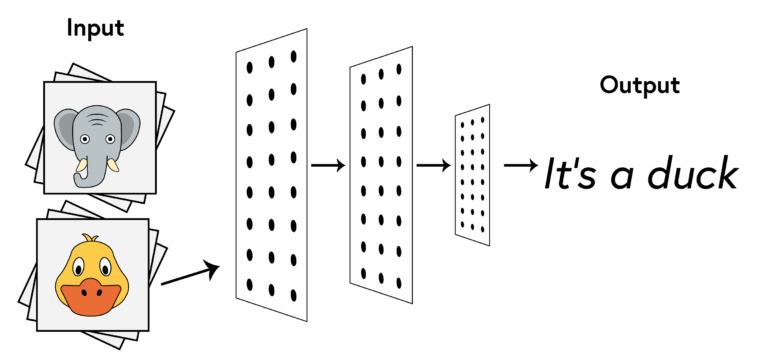
A neural network consists of at least one or possibly a large number of processing nodes that are interconnected and allow data to be fed through the network in a forward fashion and its output filtered using several output nodes. Each node has limited functionality that assigns a weight to the incoming connection. To understand better, how a neural network works, let us step through an example of a simple neural network. Assume that we want to classify images that we input to a system to identify according to animal type. In our case, the neural network system will, for example, identify a duck based on an existing training set of duck images.
Each node in our image maps to a small function that provides an output given a specific input. The most basic neural network is called a ‘perceptron’, and is simply a single-layer neural network, while the more complex, multilayer network, is called a multi-layer perceptron.
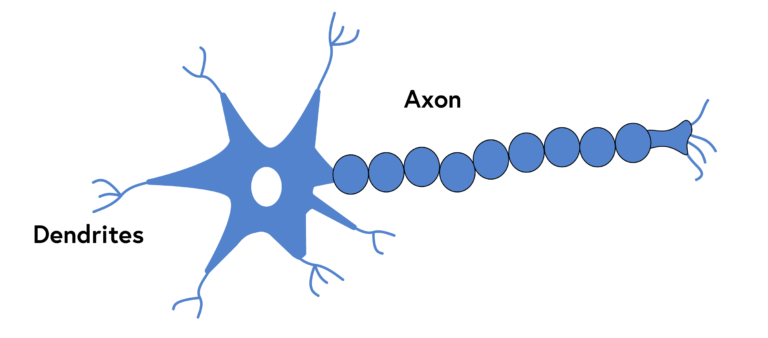
The figure below shows how a biological neuron works, where typically billions of neurons are connected to each other. A biological representation includes a variety of features, but here we will just focus on the ones related to the artificial neural network. An axon is an outgoing neuron that allows a perceptron to communicate, while the dendrites represent the input points, and the end of the axon demonstrates a set of dendrites that can actually connect to another dendrite, and thus to be able to pass information from one axon to another.
A common goal for data scientists in artificial intelligence is to be able to classify data and associate data to different categories. The example of classifying spam emails includes a powerful algorithm that helps us classify whether an email is malicious or not.
To classify data into different categories we can use a simple perceptron as the basis of our implementation. Let us see a simple example to understand how a perceptron really works using a two-dimensional space.
The following diagram demonstrates a perceptron that has three incoming values and a single output.
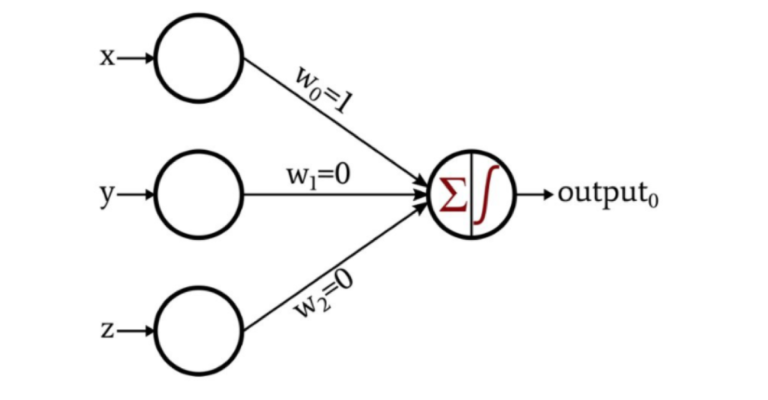
The incoming values are x, y, z, like a dendrite, and each one of these input nodes is connected via a weighted edge to the output node; the weights are shown as w0, w1 and w2. The weighted sum of the three values is transmitted to the output node. Which then passes this value to an activation function. The activation function is applied to the weighted sum, in our case we can apply the unit step threshold as shown in the next figure.
The activation function is used to map the input into a value set such as (0,1). Finally, we input a bias value as an input component that has a constant value of 1.
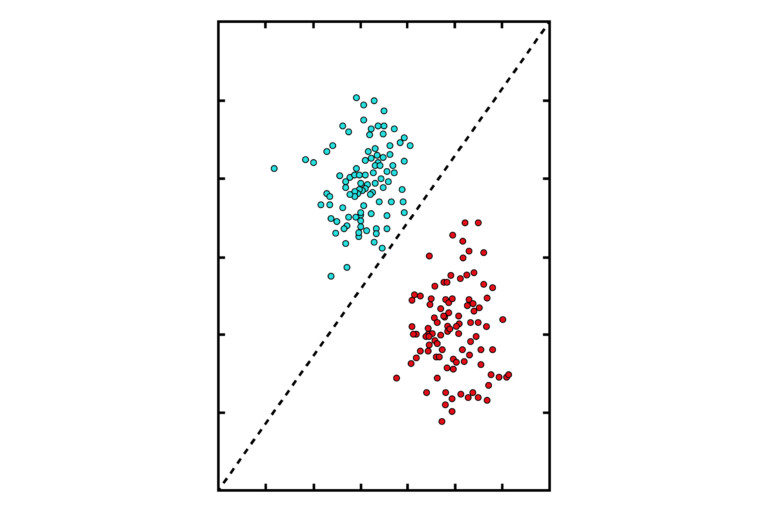
In a simple example, shown in the figure below, a dataset is plotted to demonstrate the relationships present in the data. We can easily identify that there are two sets of data, the red and cyan sets. A perceptron, in this case, will help us categorise the data by drawing a line between the points, such that it will create a linear boundary to identify the two different classes.
This means that any point above the line belongs to the cyan colour category (for example is a ‘ham’ email) and any point below the line belongs to the red colour category (for example is a ‘spam’ email).
In the previous figure of the perceptron with the three inputs, if we consider x as the first input, y as the second input, and z as the bias, then the activation function will classify a point as either 0 or 1, where 0 is the red group of data and 1 is the cyan.
Let us summarise how a single perceptron works. Each perceptron is a node that consists of a few simple functionalities:
- One or more input values or input layers
- Weights and bias
- A net sum
- An activation functions


Reach your personal and professional goals
Unlock access to hundreds of expert online courses and degrees from top universities and educators to gain accredited qualifications and professional CV-building certificates.
Join over 18 million learners to launch, switch or build upon your career, all at your own pace, across a wide range of topic areas.


