Skip main navigation

New offer! Get 30% off one whole year of Unlimited learning. Subscribe for just £249.99 £174.99. New subscribers only T&Cs apply

Find out more

Googling for the future

Googling for the future (06:02)
9
So, to get us started here’s an example of the kind of research Tobias and I have been doing with this new big data. Something we’ve been particularly fascinated by is data from the internet. So data on what people are looking for on Google, data on what pages people are looking at on Wikipedia, or data on who’s talking to who on Twitter for example. So let’s start with data from Google. Something particularly exciting about this data set is its global breadth. Never before have we had an opportunity to measure what information people are interested in all around the world. But it can be tricky to compare such data between countries, because people in different countries search in different languages.
60.4
People in France might search in French, for example. People in Germany might search in German. One day, Tobias and I and our co-authors, Stephen Bishop and Gene Stanley, had a moment of inspiration. We realised there is one thing which is almost universal between languages. And that’s the year in Arabic numerals, so 2014, 2015, 2013, for example. So using data from 2010, we considered all countries which have more than 5 million internet users. And we measured how often they were searching for the next year, 2011, and how often they were searching for the previous year, 2009. On this map, countries which are coloured in blue were searching more for the next year, 2011.
119.4
Countries which are coloured in red are searching more for the previous year, 2009. The countries coloured in grey are countries which didn’t have enough internet users for us to carry out this analysis. If you look at this map, you might recognise a pattern. People who live in countries coloured in blue, so Germany or Switzerland or Australia, for example, in a global context, tend to be relatively well-off. Whereas people who live in countries coloured in red, so India for example, again, in a global context, don’t tend to be so well-off. So we were really fascinated by this relationship and wanted to explore it further.
164.6
For this reason, we calculated for all 45 countries which were used in this study, the ratio between how often inhabitants in a particular country are searching for the next year’s Arabic numeral, 2011, and the past years Arabic numeral, 2009. This ratio we call the future orientation index. And when we plot the future orientation index against the one key economic variable, GDP per capita, we find a very striking relationship, as shown in this graph. So a future orientation index of one, means that we recorded in this particular country the same number of searches for the next year’s Arabic numeral compared to the past year’s Arabic numeral.
228.8
If the future orientation index is larger than one, then this means searches for the next year’s Arabic numeral, 2011, dominated the relationship, compared to a future orientation index which is smaller than one, when the past year’s Arabic numeral and in particular searches for that, dominated the behaviour. So we find that the data points of these 45 countries cluster around a straight line. In fact, we find a significant correlation between the future orientation index and GDP per capita of 0.78. We were wondering what might drive this behaviour which we can see. And we came up with two leading hypotheses.
289.1
Hypothesis number one, there might indeed be a relationship to which extent people are engaging with future and past and how economically well a country is doing. Hypothesis number two, the behaviour we find might reflect to which extent internet infrastructure is available in countries throughout the world. If the internet is basically following you everywhere, you can use it to organise your everyday life to find context in almost real time and to search for future events, compared to countries in which the internet and the level of internet infrastructure only allows you to maybe look up historic events.
345.8
So these were the two hypotheses we came up with in this first initial study. And this was what we wanted to share with you first and there’s much more to come.

To get us started, here’s an example of the kind of research we’ve been doing with this new “big data”.

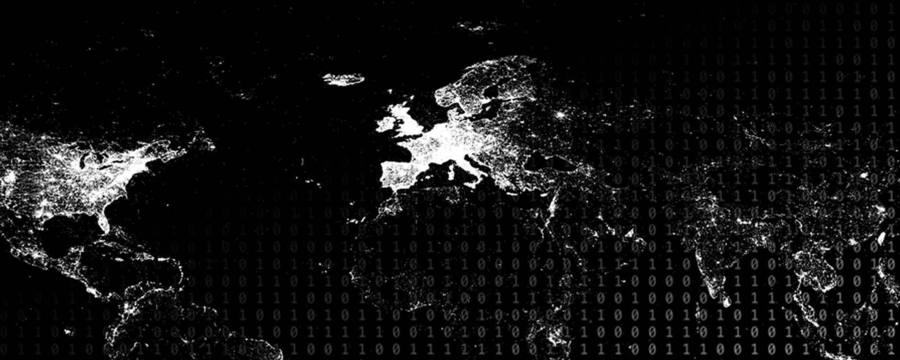
Something which we’ve been particularly fascinated with is data from the Internet, such as data on what we search for on Google. This data is global: never before have we had an opportunity to measure what information people are looking for all over the world. Watch this video to find out what we discovered in this data, and what challenges we had exploiting this global depth.

You will have the opportunity to download and analyse raw data from Google and Wikipedia, if you wish, by following the exercises that start next week.

This article is from the free online

Big Data: Measuring And Predicting Human Behaviour

Created by
FutureLearn - Learning For Life

Reach your personal and professional goals

Unlock access to hundreds of expert online courses and degrees from top universities and educators to gain accredited qualifications and professional CV-building certificates.

Join over 18 million learners to launch, switch or build upon your career, all at your own pace, across a wide range of topic areas.

Start Learning now