Skip main navigation

New offer! Get 30% off one whole year of Unlimited learning. Subscribe for just £249.99 £174.99. New subscribers only T&Cs apply

Find out more

How Hurricane Sandy’s impact was captured in Flickr data

How Hurricane Sandy's impact was captured in Flickr data (06:32)
6.6
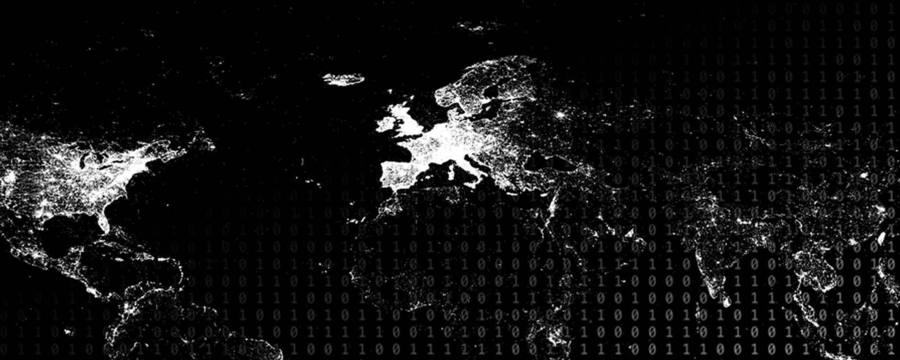
Hello, again. So we were interested in looking at human behaviour in particular during the times of disasters. So Suzy and I together with our colleagues from UCL, Philip Treleaven and Stephen Bishop, but also Gene Stanley at Boston University, we looked at a data source we have presented you with in the very beginning of this course. And this is the Flickr map. You might remember that this map consists of 32 million photos taken in 2012 and subsequently uploaded by users around the globe to the photo sharing website, Flickr. So these are the photos which carried location based information and GPS stamps. And this is the reason why we were able to plot on the map all of these individual photos locations.
69.3
So we were wondering whether Flickr can also tell us something related to disasters. And for this reason, we looked at one specific case study in which we wanted to explore this relationship. And this case study is one recent disaster which unfortunately hit the Northeast coast of the United States in 2012, Hurricane Sandy. So we retrieved from the photo sharing website Flickr via the Application Programming Interface all the photos which were taken in a period of one month in which Hurricane Sandy occurred. And we used only the photos which were entitled or had the tag relating to Hurricane Sandy. So specifically, we used the photos in which ‘Hurricane’ ‘Sandy’ or ‘Hurricane Sandy’ was used to describe the content of the photo.
138.4
So these photos contain very exact time stamps, down to the second. We used this stream of photos to calculate hourly counts on how many photos were taken by users around the globe relating to Hurricane Sandy. As you can see in this figure, the number of photos relating to Hurricane Sandy is going up over time, peaking at a certain point, and decreasing afterwards.
175.9
So we were interested in how this relates to the actual strength of the hurricane. So we had to find one environmental quantity, one environmental variable, which quantifies the strength of this disaster. For this reason, we used the atmospheric air pressure, and we averaged the air pressure in the US state, New Jersey, where Hurricane Sandy had landed. As you can see here, air atmospheric pressure is going down over time, reflecting that wind speed is becoming stronger and stronger, and actually reaching the minimum in atmospheric air pressure when Hurricane Sandy made landfall, meaning when the hurricane reached land. This is the moment in time when you record the highest wind speeds.
235.3
If you look at both curves together, you see that they nicely mirror each other. So the number of photos going up and atmospheric pressure going down is actually reaching the point when the hurricane made landfall where we actually register, in exactly the same hour, the most photos taken and subsequently uploaded to the photo sharing platform and the peak in atmospheric air pressure. Afterwards, the relaxation down to normal levels also mirrors nicely each other. So this is a first example, demonstrating this close link between attendance of people relating to a disaster like Hurricane Sandy and the strength of the actual disaster. So why is this important, you might ask?
298.8
We are definitely not suggesting that we are replacing the measurement of atmospheric air pressure by looking at social media or other online platforms. But it might help emergency response teams to actually get a better idea how people react to a disaster. And as we have explained many times before, they get this information in a real time fashion, or at least close to real time. So if emergency teams can better respond to this emergency, then there might be further down the line also the possibility for other improvements. So after the disaster has happened, there are emergency companies or, in particular, reinsurance companies tasked with assessing the damage.
351.2
And in order to assess the overall damage, they have to manually send out people investigating all the damages to individual houses and to aggregate all these individual damage reports. So it’s another example of now-casting and where online sources might be able to help. Not necessarily to justify an individual claim to an insurance company, but to get a better picture, much closer to the event of what claims, what overall claims, a reinsurance company might face.

So far, we’ve discussed various examples of how data from Google, Wikipedia and Twitter might give us new insight into human behaviour. Increasingly however, the information we are uploading to the Internet does not only contain text, but pictures too.

Watch this video to hear how environmental changes caused by Hurricane Sandy in 2012 were reflected in activity on the photo-sharing site Flickr. How might such findings be of use to policymakers and insurance companies?

This article is from the free online

Big Data: Measuring And Predicting Human Behaviour
Created by
FutureLearn - Learning For Life

Reach your personal and professional goals

Unlock access to hundreds of expert online courses and degrees from top universities and educators to gain accredited qualifications and professional CV-building certificates.

Join over 18 million learners to launch, switch or build upon your career, all at your own pace, across a wide range of topic areas.

Start Learning now