Skip main navigation

The Coriolis Effect

Satellite dish

In this video, Pete uses a turntable and a ball to simulate the effect of the Coriolis force. The ball is deflected on a curved trajectory, across a rotating surface, to help you visualise a parcel of air moving over the Earth’s surface.

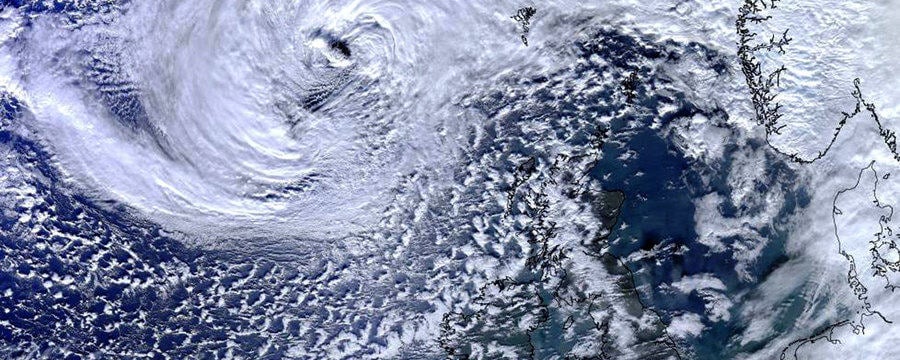
As air tries to move from high to low pressure in the atmosphere, the Coriolis force diverts the air so that it follows the pressure contours. In the Northern Hemisphere, this means that air is blown around low pressure in an anticlockwise direction and around high pressure in a clockwise direction.

Think about a person standing at the Equator. In the course of a day, the planet rotates once, meaning that you travel a colossal 2π x R (the radius of the Earth – 6370km) = 40,000km through space – a speed of about 1700km/ hr. You don’t notice that you are travelling so fast, because the air around you is travelling at the same speed, so there is no wind. On the other hand, if you are standing at a Pole, all you do in the course of a day is turn around on the spot, you have no speed through space and similarly the air around you is stationary.

Now, think about really fast moving, Tropical air which is being pulled towards the poles by a pressure gradient. As it travels polewards, it moves over ground which is rotating more slowly, and so it overtakes the ground, and looks like it is moving from west to east. Similarly, slow moving polar air will be left behind by the rotating Earth and look like it is moving from east to west if it is pulled equatorward by a pressure difference.

In general, moving air in the Northern hemisphere is deflected to the right by the Coriolis Effect.

As the air blows from high to low pressure the Coriolis force acts on it, diverting it, and we end up with air following the pressure contours and blowing around low pressure in an anticlockwise direction and around high pressure in a clockwise direction (both true only for the Northern Hemisphere). Near the ground, friction slows the air down a bit so that, in practice, the wind does actually blow ever so slightly towards the centre of the depression.

A diagram of a series of arrows flowing in different directions

Figure 1: Schematic representation of flow around a low pressure area. Pressure gradient force represented by blue arrows. The Coriolis force, always perpendicular to the velocity, by red arrows. © SVG version, Roland Geider (Ogre), of the original PNG, (Cleontuni)
In this diagram, the black arrows show the direction the air is moving in. The Coriolis force pulls the air to the right (red arrows). As the air is being pulled in to the depression by the pressure gradient (blue arrows), it is continuously deflected by the Coriolis Force. When the air moves in a circle around the depression, the Coriolis force (red arrows) is balanced by the pressure gradient force (blue arrows).
In summary, for the Northern Hemisphere:
  • Low pressure is called a cyclone and has anticlockwise winds blowing around it.
  • High pressure is called an anticyclone and has clockwise winds blowing around it.
  • The wind tends to blow along the pressure contours. For an example, see the BBC website.
  • We name winds by the direction they are blowing from.
  • Buys Ballot’s Law states that “In the Northern Hemisphere, if you stand with your back to the wind then the lower pressure will be on your left”
  • Alternatively, some people find the rule ‘righty tighty, lefty loosey’ a useful reminder of the direction of rotation – high pressure is like tightening a screw (righty tighty) and low pressure like loosening a screw (lefty loosey) (Figure 2).
On the left is a circle with arrows pointing anticlockwise and on the right is a circle with arrows pointing to the clockwise
Figure 2: Air blows around a low pressure in an anticlockwise direction and around a high pressure in a clockwise direction in the Northern Hemisphere © RMetS
What about the Southern Hemisphere?
In the Southern Hemisphere, winds blow around a high pressure in an anticlockwise direction and around a low pressure in a clockwise direction.
The simplest way of visualising why this is the case is to take a ball (or an apple or orange, or anything spherical!). Mark on the poles and the equator, and then mark a spot in the ‘northern hemisphere’ and the ‘southern hemisphere’ of your sphere. Rotate your sphere. Keeping it rotating, tilt your sphere so that you are looking at it from the North Pole – your northern hemisphere spot should be going round in an anticlockwise direction. Now, making sure you keep rotating your sphere in the same direction, tilt it so that you are looking at the ‘south pole’. Your southern hemisphere spot should be rotating in a clockwise direction. This demonstration doesn’t explain the Coriolis effect, but it does show how things can be different in the two hemispheres of the same planet.
A partial weather map of Europe which has the coast of Iceland and Bay of Biscay highlighted

This weather map, or synoptic chart, is of 24 January 2009 (Figure 3). The paler black lines show the pressure contours or isobars. They are normally drawn at 4hPa (1 hectoPascal is the same as 1 millibar) intervals – 1016, 1012 etc. There are five low pressure areas on the chart, the lowest pressure in a depression is marked with a cross and the pressure at that point is given (L 978). Similarly the centre of any high pressure areas are marked with a cross and the central value given, eg H993.

Note that whether the pressure is High or Low simply depends on whether the pressure around is higher or lower. There is no simple rule, for example, that says ‘everything over 1000hPa is high pressure’. The pressure values in High and Low areas both tend to be higher in the summer than in the winter.

The lowest pressure shown on this chart (Figure 3) is the centre of the Low just off the coast of Iceland (950hPa), but the pressure contours are much closer together around the 963hPa Low in the Bay of Biscay, so it’s that Low which has the faster winds blowing around it.

This article is from the free online

Come Rain or Shine: Understanding the Weather
Created by
FutureLearn - Learning For Life

Reach your personal and professional goals

Unlock access to hundreds of expert online courses and degrees from top universities and educators to gain accredited qualifications and professional CV-building certificates.

Join over 18 million learners to launch, switch or build upon your career, all at your own pace, across a wide range of topic areas.

Start Learning now