
What can we do with a plot?
We have seen that the Matplotlib Python library makes it easy to produce some basic graphical plots. So what makes for a good plot and how can a graphical plot be used to communicate more complex information?
The purpose of visualisation is insight, not pictures.(Ben Shneiderman)
 ©growthlakes/wikimedia
What makes a good plot?
Where can we look for inspiration?
Matplotlib gallery
Daily news
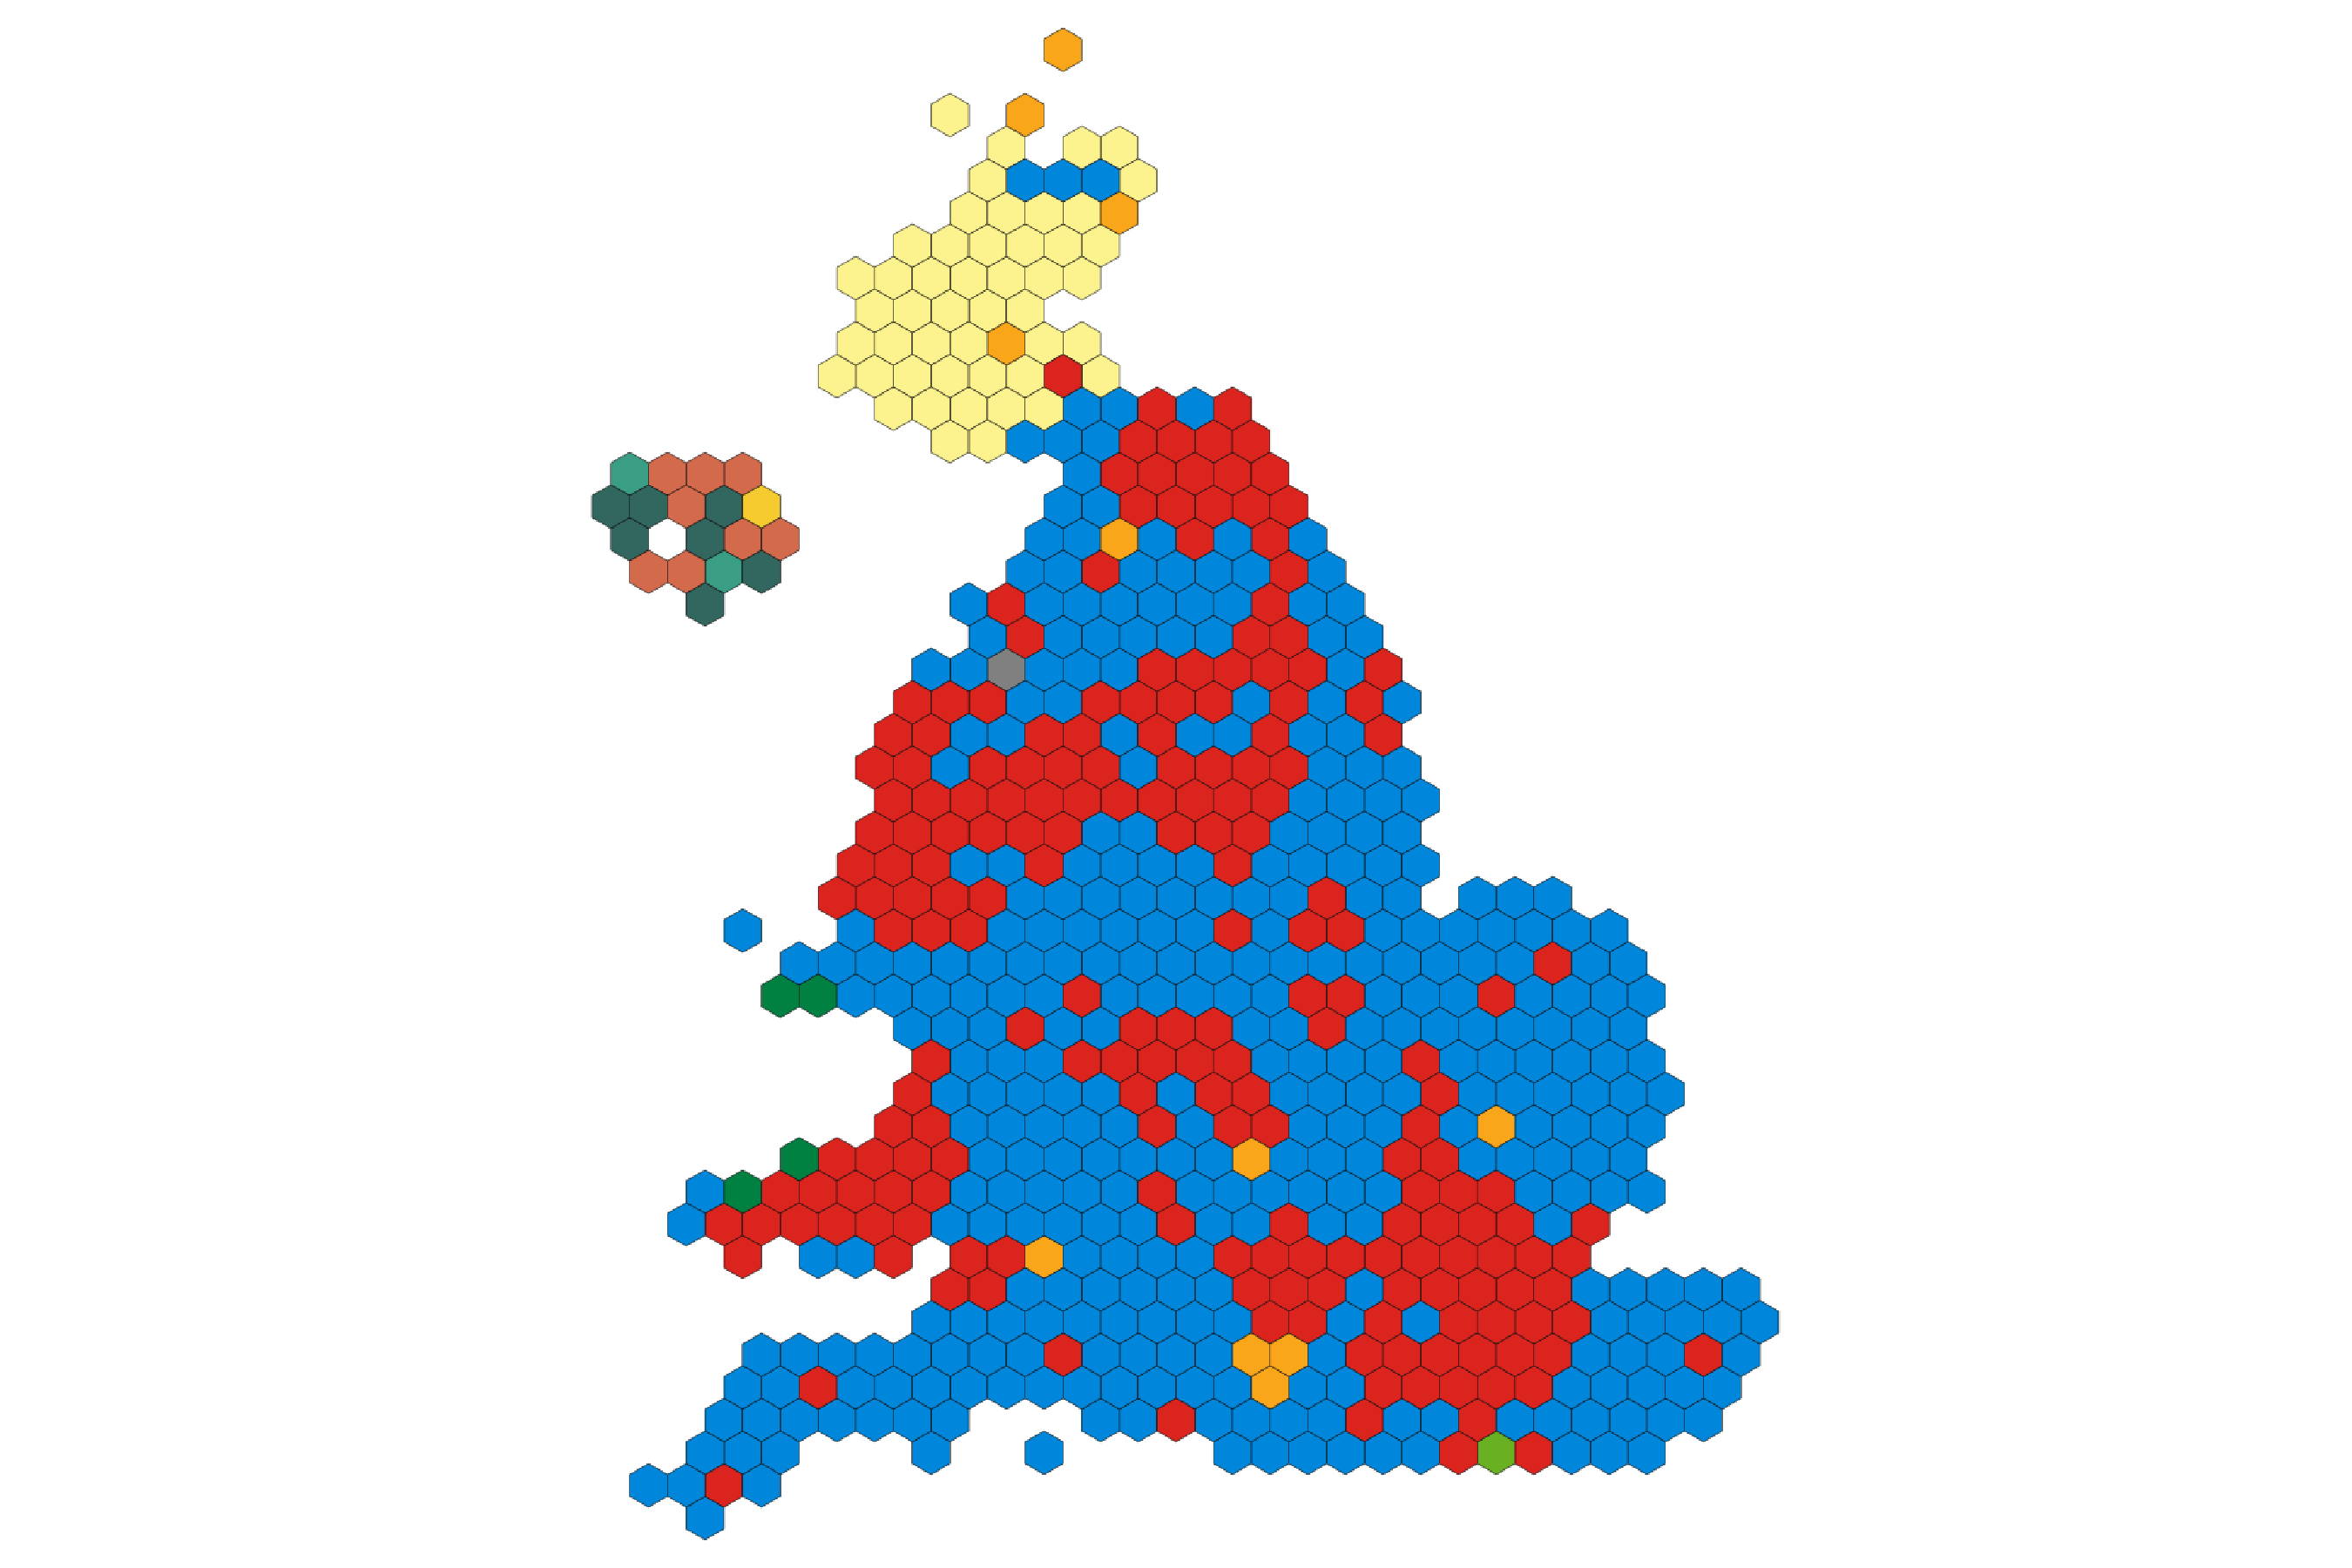 ©Bellezzasolo,odileeds.org/wikimedia, licensed under the Expat License
Historical examples
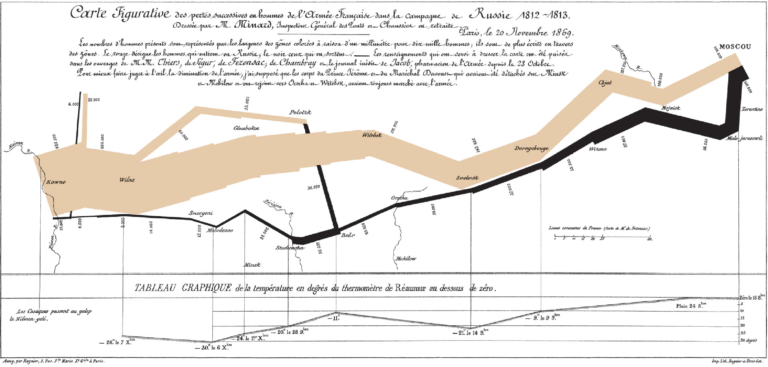
Charles Minard (1781-1870) / Public domain
Competitions
Your task
We have seen that data visualisation is very useful for communicating insights from data. Hans Rosling (1948-2017) was a master storyteller using data visualisation, for example, to raise awareness of trends in global health. To see an example of Hans Rosling’s innovative storytelling, watch 200 Countries, 200 Years, 4 Minutes – The Joy of Stats video (hosted on YouTube).View the Trends interactive plots in the GapMinder website. It explores life expectancy from the 1800s to now, correlated with income.In the comments area below, note anything that you observe in the data presented in GapMinder since 2009.Tip: beware of the axis scales.
Further reading
The Office for National Statistics (ONS). (n.d.). Data visualisation. https://style.ons.gov.uk/category/data-visualisation/.
Jordan, C. (2017, July 7). Make your data speak for itself! Less is more (and people don’t read). Towards Data Science. https://towardsdatascience.com/data-visualization-best-practices-less-is-more-and-people-dont-read-ba41b8f29e7b
References
BBC. (2017, June 7). From swingometers to 3D simulations: A pictorial history of general election TV graphics. The Telegraph. https://www.telegraph.co.uk/tv/0/history-british-tv-election-graphics-pictures/2015-election-graphics-map/
BBC Four. (2010, November 26). Hans Rosling’s 200 countries, 200 years, 4 minutes – The joy of stats – BBC Four [Video]. YouTube. https://www.youtube.com/watch?v=jbkSRLYSojo
BBC Visual and Data Journalism. (2019). How the BBC visual and data journalism team works with graphics in R. Medium. https://medium.com/bbc-visual-and-data-journalism/how-the-bbc-visual-and-data-journalism-team-works-with-graphics-in-r-ed0b35693535
Gapminder. (n.d.). Bubbles. https://www.gapminder.org/tools/#$chart-type=bubbles
Mason, B. (2017, March 16). The underappreciated man behind the “best graphic ever produced”. National Geographic. https://www.nationalgeographic.com/news/2017/03/charles-minard-cartography-infographics-history/
Matplotlib. (2020). Gallery. https://matplotlib.org/gallery/index.html
SCiPy. (2019). Plotting contest. https://www.scipy2019.scipy.org/plotting-contest
Tufte, E. (1983). The visual display of quantitative information. Graphics Press.
Get ready for a Masters in Data Science and AI

Get ready for a Masters in Data Science and AI





